
You post consistently, your content looks good, and yet the numbers don't move the way they should. That gap usually traces back to one thing: you're guessing at what your audience actually does, instead of measuring it. Customer behavior analysis for marketing is the practice of studying how people interact with your brand, what stops them mid-scroll, what makes them click, and what pushes them to buy, so you can stop guessing.
This guide breaks down exactly what customer behavior analysis means and how to run it step by step, from tracking engagement patterns to interpreting purchase signals across your funnel. You'll see how to turn raw data into decisions you can actually act on, not just a dashboard full of numbers nobody reads.
We built our own Attention Engine on this exact discipline, using patterns from over 750,000 videos to identify what actually drives conversions rather than vanity metrics. Below, you'll get the same framework: what data to collect, how to analyze it, and how to apply it so your marketing stops relying on hunches and starts running on evidence.
Why customer behavior analysis matters for marketing
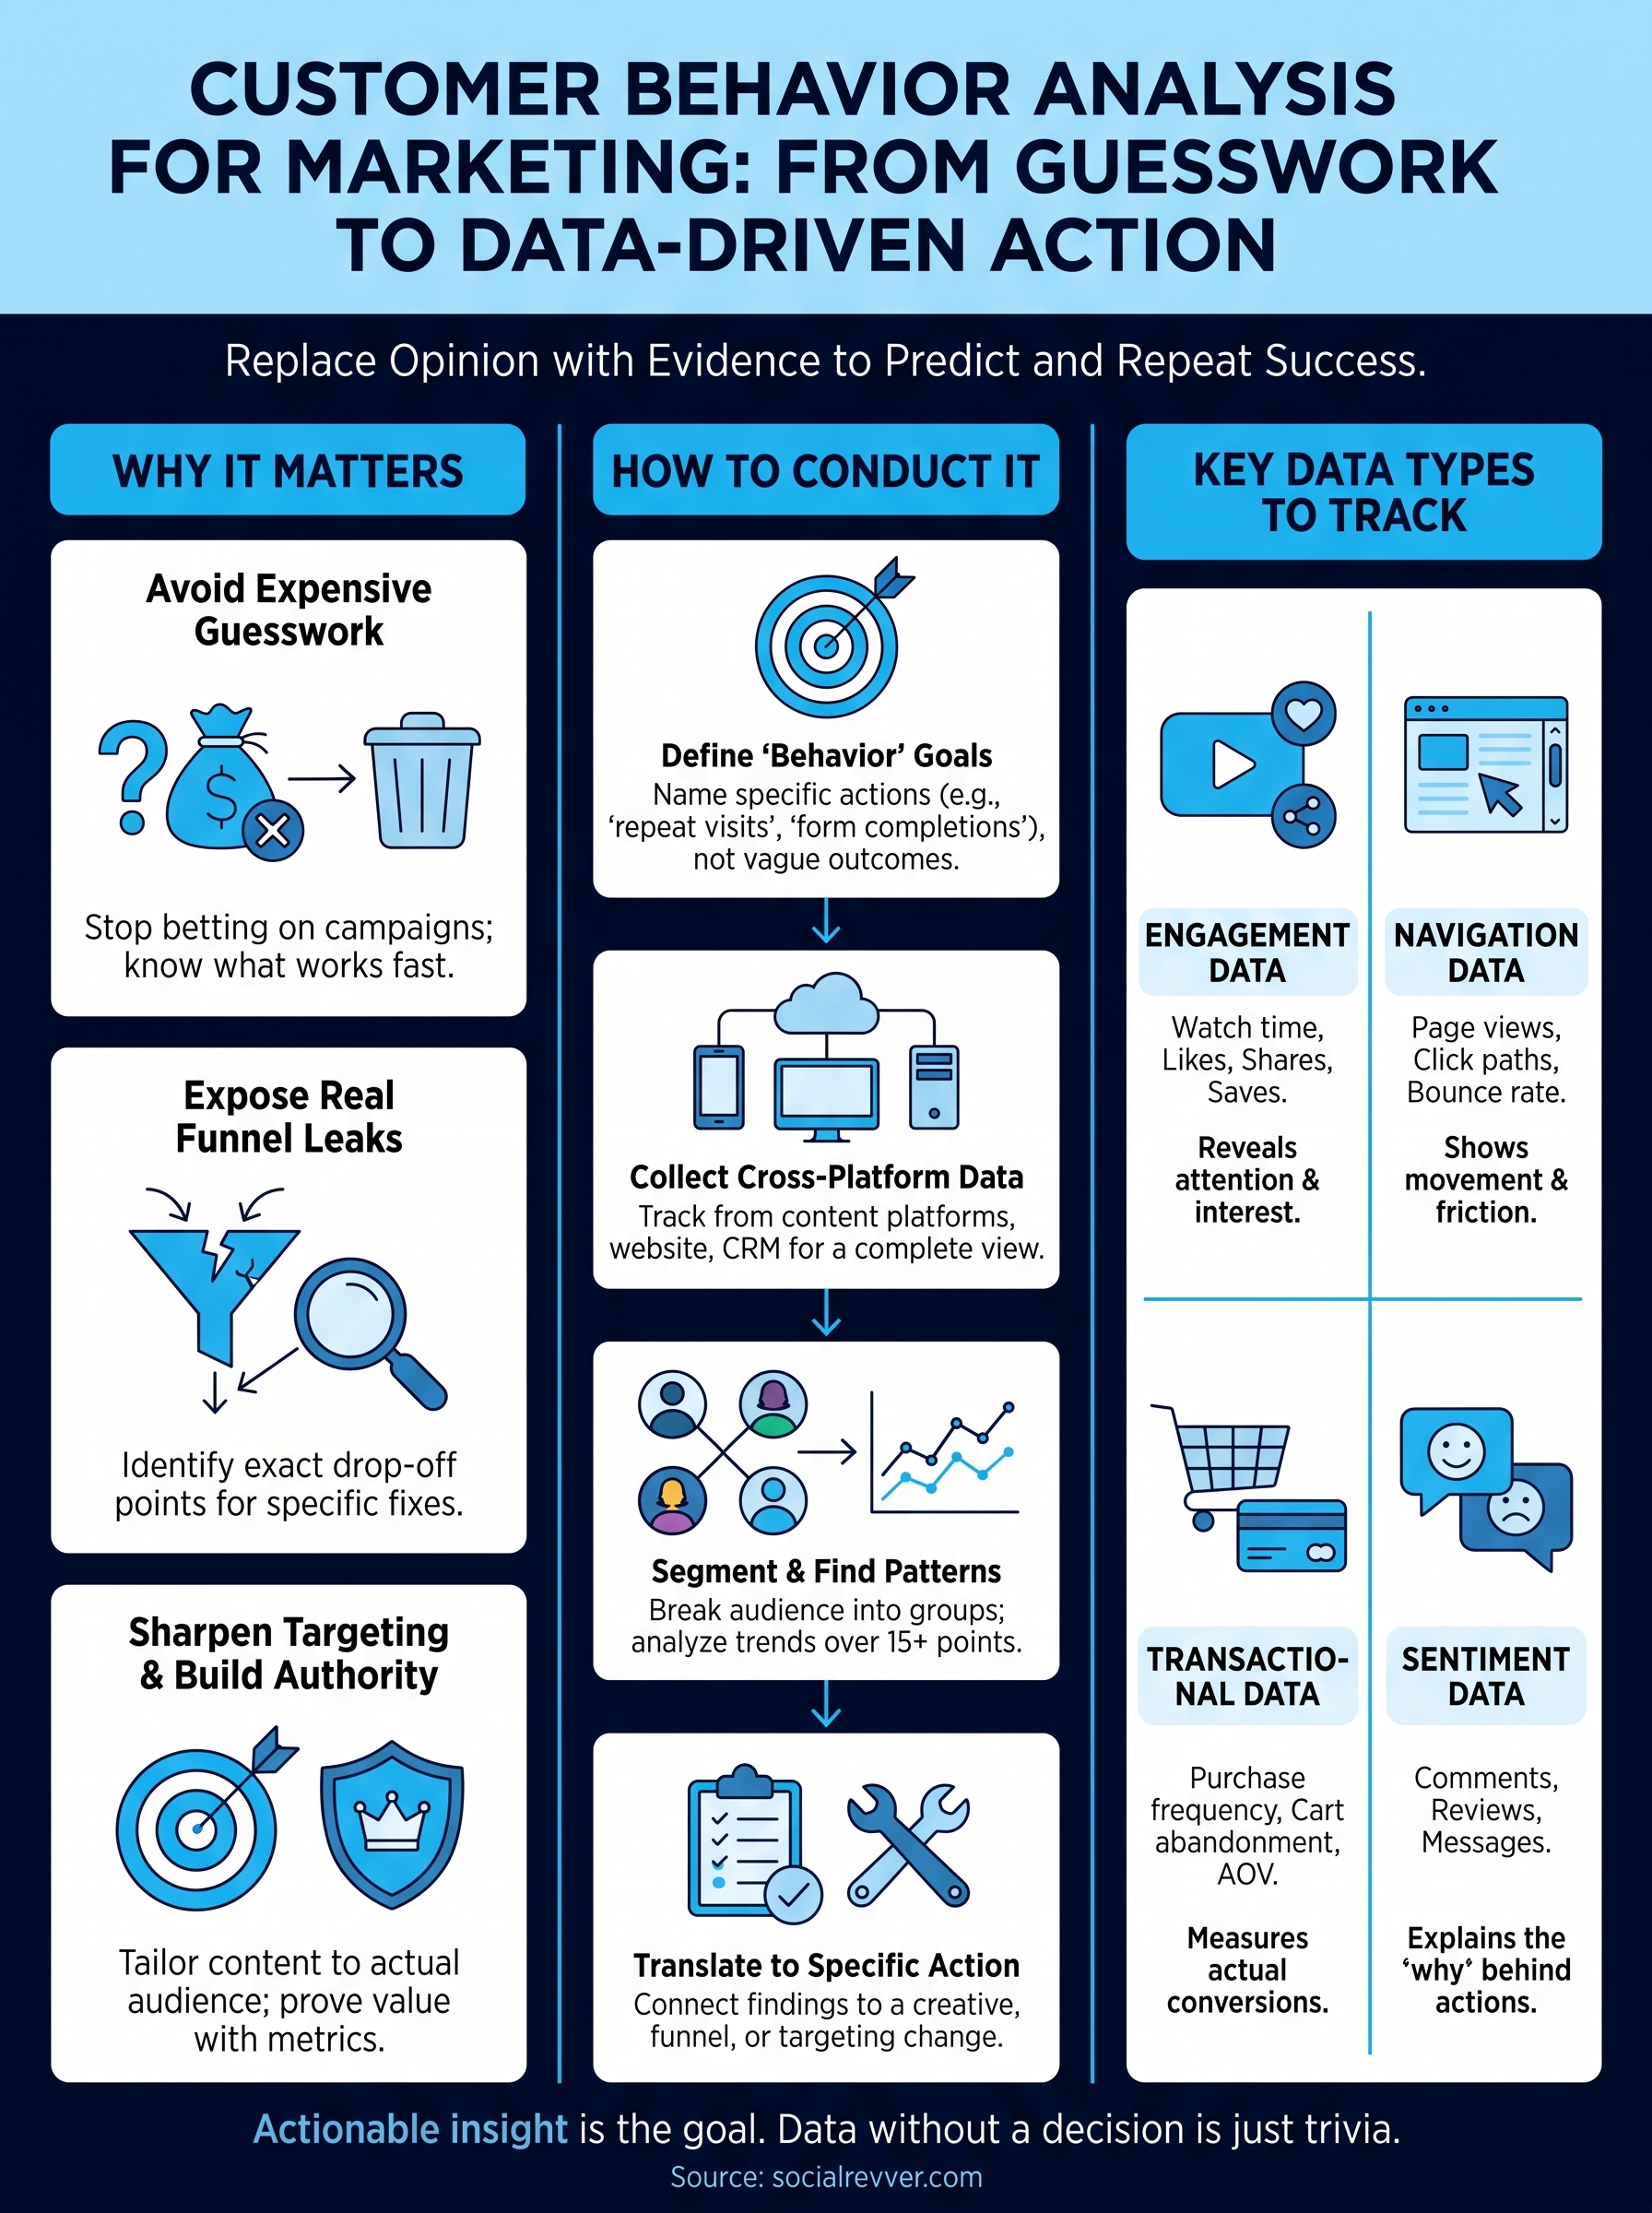
Most marketing teams still make decisions based on opinion. Someone likes a hook, a founder prefers a certain color palette, and the content goes live without any real evidence it will perform. Customer behavior analysis replaces that guesswork with data pulled directly from how people actually respond, click, scroll, and buy. For founders and business owners trying to build category authority, that shift matters more than any single viral post, because it turns marketing into something you can predict and repeat instead of something you hope works.
Guesswork gets expensive fast
Without behavior data, every campaign is a bet. You spend on ads, produce content, and wait to see what sticks, then repeat the process next month with slightly different guesses. That's slow and costly, especially for brands competing for investor credibility or premium clients who expect a polished, consistent presence. When you track behavior instead, you know within days which hooks stop the scroll and which offers convert, so budget stops leaking into content that was never going to work.
If you can't explain why a piece of content worked, you can't repeat it on purpose.
It exposes real funnel leaks
Behavior analysis shows you exactly where prospects drop off, not just that they dropped off. Maybe your video hooks people for the first three seconds but loses them before the call-to-action. Maybe your landing page gets clicks but no signups. Vanity metrics like follower count or total views can't tell you that. Engagement drop-off points and conversion path data can, and they point you toward the specific fix instead of a vague "post more" strategy.
| Metric type | What it tells you | Where it points |
|---|---|---|
| Watch-time retention | Where attention breaks | Hook or pacing fix |
| Click-through rate | Whether the offer is compelling | Copy or CTA fix |
| Landing page conversion | Whether the pitch matches expectations | Page or funnel fix |
| Repeat engagement | Whether content builds trust over time | Content strategy fix |
It sharpens targeting and creative decisions
Once you know how your actual audience behaves, you stop making content for an imagined audience and start making it for the one that shows up. This matters most for business owners who need inbound leads rather than random reach. Behavioral segmentation, grouping people by what they actually do rather than who they claim to be, lets you tailor scripts, offers, and posting times to the people most likely to convert. That's the same principle behind SocialRevver's Strategy Intelligence system, which studies patterns across hundreds of thousands of videos to find what genuinely drives action instead of what merely looks good.
It builds authority instead of vanity metrics
Sophisticated audiences, especially founders and creators chasing higher-paying deals, care less about follower counts and more about proof that a brand commands attention and trust. Consistent behavior analysis lets you demonstrate that proof with real numbers: retention rates, lead volume, conversion percentages. Tracking this over time also protects you from chasing short-lived trends that spike views but never build lasting authority. Understanding audience psychology, per research from the American Psychological Association, consistently outperforms guesswork when it comes to influencing decision-making, and marketing is no exception.
How to conduct a customer behavior analysis
Running a real analysis isn't complicated, but it does need a sequence. Skip a step and you end up with data that looks impressive but doesn't tell you what to do next. Here's the process we use before we ever touch a script or a posting calendar.
Define what "behavior" means for your goal
Start by naming the specific action you care about, not a vague outcome like "more engagement." If you're a founder building investor credibility, the behavior that matters might be repeat profile visits or saves. If you're chasing leads, it's clicks to your link in bio or form completions. Defining the target behavior first keeps every metric you collect tied to a real business outcome instead of a number that just feels good to report.
A metric only matters if you can name the decision it changes.
Collect data from every touchpoint, not just one platform
Pull data from your content platforms, your website analytics, and your CRM if you have one. A single-platform view will lie to you, because someone might watch a video on Instagram, then convert on your site three days later. Cross-platform tracking connects those dots so you're not crediting the wrong channel or missing the real path to purchase.
Segment before you analyze
Don't average everything together. Break your audience into groups: new versus returning viewers, cold traffic versus warm leads, mobile versus desktop. Behavioral segmentation at this stage prevents a high-performing niche audience from getting buried under the noise of casual scrollers who were never going to buy.
Look for patterns, not single events
One viral post or one bad week doesn't tell you much. Look at trends across at least 15 to 20 pieces of content or a full sales cycle before drawing conclusions. This is where a large comparison set helps, which is why our own Strategy Intelligence system leans on patterns across 750,000+ videos instead of just your own small sample.
Translate findings into a specific change
Every analysis should end with an action, not just a report. Use a simple checklist to keep the process honest:
- What behavior did we track?
- What pattern did we find?
- What specific creative, funnel, or targeting change does this justify?
- How will we know if the change worked?
If you can't answer all four, the analysis isn't finished yet. Actionable insight is the entire point of this exercise; data without a decision attached is just trivia.
Key types of customer behavior data to track
Not every business needs to track the same signals, but most useful analysis draws from four buckets: engagement, navigation, transaction, and sentiment. Mapping these categories upfront keeps you from drowning in dashboards while missing the two or three metrics that actually predict revenue. The table below gives you a quick reference before you decide what to pull first.
| Data type | What it captures | Example metrics |
|---|---|---|
| Engagement | Attention and interaction | Watch time, likes, shares, saves |
| Navigation | Movement through your funnel | Page views, click paths, bounce rate |
| Transactional | Actual buying behavior | Purchase frequency, cart abandonment, average order value |
| Sentiment | How people feel about you | Comments, reviews, survey responses |
Engagement data
Engagement data tells you whether your content earns attention in the first place. Watch-time retention on video, comment sentiment, and share rate all show you how far someone gets before losing interest. Hook performance in particular deserves close attention, since most drop-off on short-form video happens in the first three seconds.
Attention you can't measure is attention you can't improve.
Navigation and on-site behavior
Once someone leaves your content and lands on your site, navigation data picks up the story. Click paths, scroll depth, and time on page reveal whether your landing page delivers on what your content promised. Session recordings and heatmaps, available through tools like Google Analytics, add texture here by showing exactly where visitors hesitate or abandon the page.
Purchase and transactional behavior
Transactional data is the closest thing to ground truth, because it tracks money moving, not just attention. Purchase frequency, cart abandonment rate, and average order value tell you whether your content and offers are actually converting or just generating noise. Founders chasing investor credibility should weight this category heavily, since revenue behavior speaks louder than reach in almost every pitch deck.
Sentiment and qualitative signals
Sentiment data captures the why behind the numbers. Comments, direct messages, and review text reveal objections and motivations that click data alone can't explain. Reading a batch of comments after a high-performing post often surfaces the exact phrase or pain point worth testing in your next script, which is a faster shortcut than waiting on another full analysis cycle.
Customer behavior analysis examples in practice
Theory only helps once you see it applied to a real business problem. Below are three scenarios pulled from the kind of accounts we work with at SocialRevver, each showing how a specific behavior signal led to a specific fix instead of a vague "try something new" recommendation.
A founder's videos got views but no inbound leads
One SaaS founder was posting weekly and pulling solid view counts, but demo requests stayed flat. Watch-time data showed viewers dropped off right after the hook, before the offer ever appeared. Retention curve analysis pointed to a pacing problem, not a targeting problem. Once the scripts moved the offer earlier and tightened the first eight seconds, demo requests rose without any increase in ad spend or posting frequency.
The fix wasn't more content, it was a different second act.
A retail brand saw traffic but high cart abandonment
A direct-to-consumer brand had strong click-through rates from short-form content but lost most of that traffic at checkout. Session recordings showed shoppers hesitating on the shipping cost page, then leaving. Navigation data exposed the exact abandonment point, something view counts or engagement rate never would have revealed. Moving shipping cost disclosure earlier in the funnel cut abandonment by a meaningful margin within two weeks.
A creator's comments revealed the wrong audience segment
A creator building toward brand deals had healthy engagement but low conversion on affiliate links. Reading through comment sentiment showed most engaged viewers were other creators, not buyers, people cheering the production quality rather than the product. Sentiment analysis flagged a segment mismatch that raw engagement numbers had hidden. Shifting scripts to speak directly to end buyers, rather than industry peers, lifted affiliate click-through without losing overall engagement.
| Scenario | Signal that revealed the problem | Action taken |
|---|---|---|
| Founder, low leads | Watch-time drop before CTA | Moved offer earlier in script |
| Retailer, cart abandonment | Session recording hesitation point | Disclosed shipping cost sooner |
| Creator, weak affiliate sales | Comment sentiment mismatch | Rewrote script for buyer segment |
Each of these cases started with the same move: isolate one behavior signal, trace it to a specific point in the funnel, then change one thing and measure again. Pattern-based diagnosis like this is exactly what a large comparison set, like the 750,000-video dataset behind our Strategy Intelligence system, is built to speed up. Instead of waiting months to spot these patterns manually, you compare your account's behavior against thousands of similar cases and shortcut straight to the fix that actually moves revenue.
Common mistakes that skew customer behavior analysis
Even good data can lead you to a bad decision if you misread it. Most of the mistakes below aren't about missing tools, they're about how the analysis gets interpreted once the numbers are in front of you. Catching these early saves you from optimizing your marketing around a signal that never actually mattered.
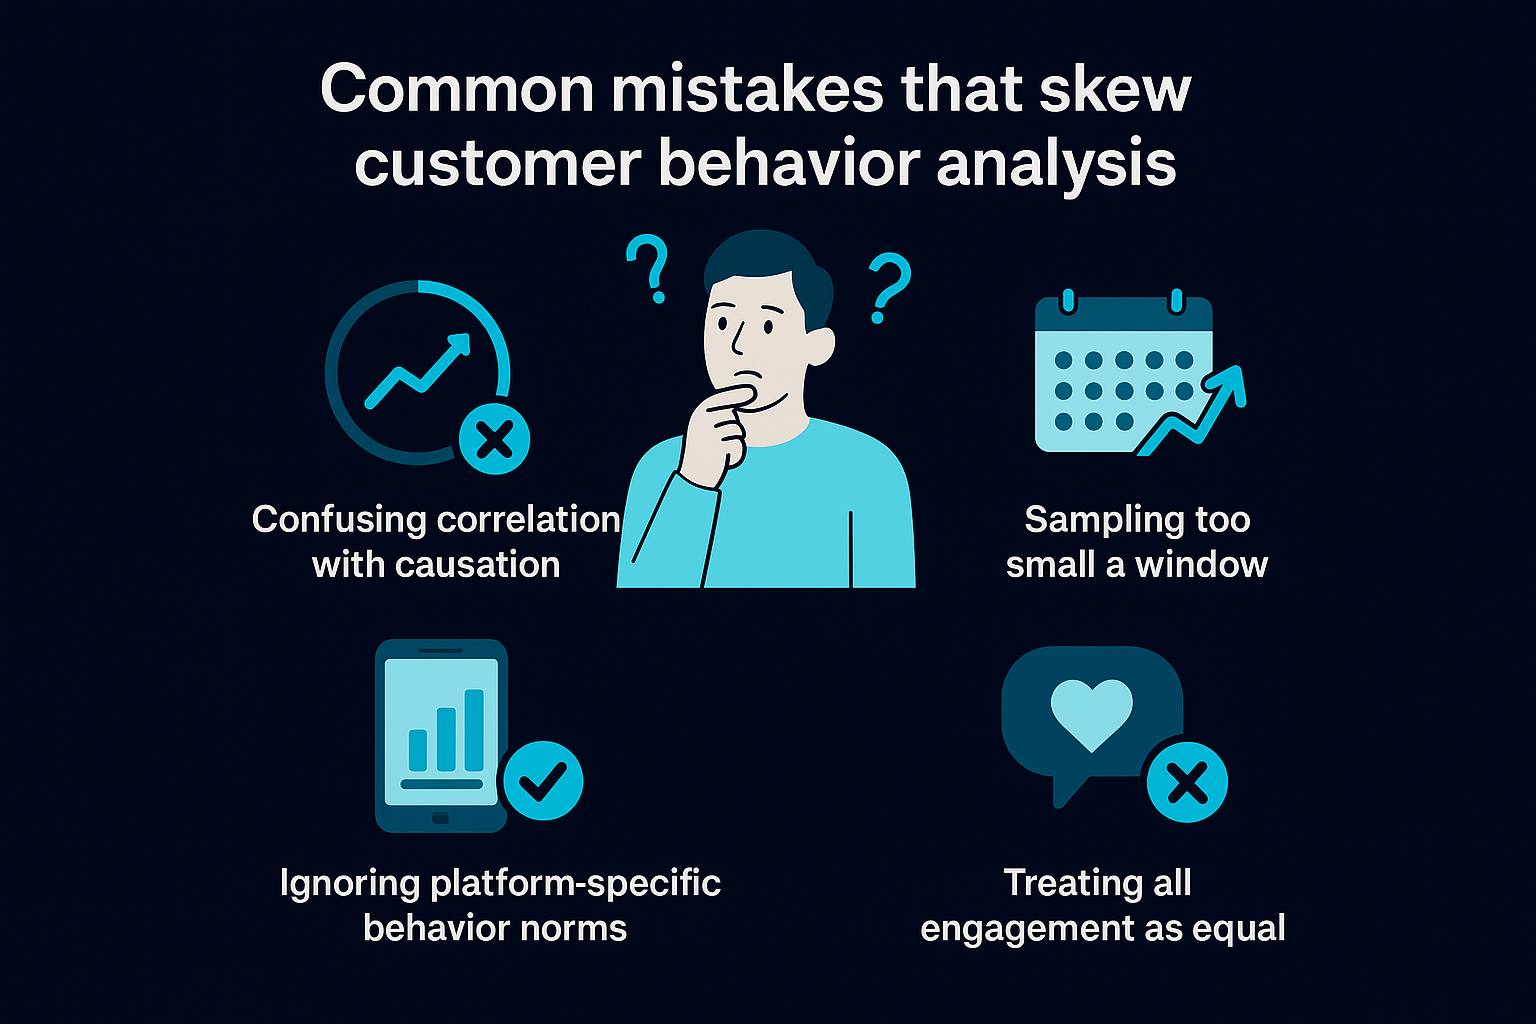
Confusing correlation with causation
Just because engagement rose the same week you changed your posting time doesn't mean the time change caused it. Maybe a competitor went quiet, maybe a trending audio boosted your reach, maybe it's coincidence. Correlation without a controlled test is one of the fastest ways to build a strategy on a false pattern. Before you commit budget to a change, isolate the variable: test one thing at a time and compare against a baseline period, not just a gut feeling that things improved.
A pattern that appears once is a coincidence, not a strategy.
Sampling too small a window
Judging performance off three posts or one week of traffic is a common trap, especially for founders eager to see results fast. Small sample sizes produce noisy data that looks like a trend but is really just variance. Give any analysis at least 15 to 20 data points, or a full sales cycle, before you draw a conclusion and change your strategy based on it.
Ignoring platform-specific behavior norms
A 40 percent retention rate might be excellent on one platform and mediocre on another, because audiences behave differently depending on where they are. Comparing raw numbers across platforms without adjusting for platform-specific benchmarks leads teams to celebrate weak performance or panic over strong performance. Always compare a metric against its own platform's typical range, not a number pulled from a different context.
Treating all engagement as equal
A share and a save don't mean the same thing, and neither does a comment that says "love this" versus one asking a real question about pricing. Lumping every interaction into one "engagement" bucket hides which signals actually predict revenue. Weighting engagement types by their proximity to a purchase decision, rather than treating a like the same as a saved post, keeps your analysis pointed at outcomes that matter.
Skipping the follow-through
Collecting data and never acting on it is its own mistake. Teams sometimes gather months of behavior reports, present them in a meeting, and change nothing. Data referenced by the Federal Trade Commission on consumer protection makes a similar point in a different context: information only protects or improves outcomes when someone actually applies it. Analysis without a follow-up action is just an expensive way to feel informed.
Turning behavior insights into marketing action
Customer behavior analysis for marketing only pays off when you close the loop between data and decision. You've seen how tracking engagement, navigation, transactional, and sentiment data exposes the exact point where prospects stall, and how one traced signal, like a drop-off before your CTA, beats a dozen vanity metrics you can't act on. Guessing got you inconsistent results. Measuring gets you a system you can repeat and defend.
None of this requires more content or bigger budgets, just sharper attention to what your audience already tells you through their behavior. The businesses that pull ahead treat every post as a data point, not a one-off bet.
If you'd rather skip months of trial and error, apply for a free 40+ slide social media strategy built from real behavior data, and see exactly where your funnel is leaking attention.