
You launched a campaign, watched the views climb, and then watched users disappear a week later. That gap between attention and retention is where most growth strategies quietly fail, and it's exactly what heap retention analysis is built to expose. If you're tracking short-form content performance or product engagement, this tool tells you whether people actually stick around after that first interaction.
Heap's retention analysis lets you build cohort-based reports that show how users behave over days, weeks, or months after a defined starting action. Instead of guessing why churn happens, you can isolate the exact drop-off points and see which user segments engage longest, giving you a data-backed view of engagement rather than a vanity metric like total signups or follower count.
In this article, we'll walk through what heap retention analysis actually measures, how to set up your first cohort, and how to read the resulting curves without misinterpreting the data. We'll also cover practical ways to turn those insights into retention improvements and connect them to the kind of consistent audience engagement that content and growth teams, including ours at SocialRevver, rely on to prove real traction.
Why retention analysis matters for growing products
Growth teams often celebrate a spike in views or downloads, but that spike means little if users vanish within days. Retention analysis answers the question acquisition metrics can't: are people getting enough value to come back? For founders and brand builders, this distinction separates a system that compounds over time from one that resets every month.
The cost of silent churn
Unnoticed churn quietly drains the return on every dollar spent driving traffic. If half your new users disappear after their first session, you're not scaling, you're refilling a leaky bucket. Cohort retention curves expose exactly when and where that leak happens, whether it's day one, day seven, or after a specific feature interaction, so you can fix the actual problem instead of guessing at a new campaign.
If you can't see when users drop off, you can't fix why they leave.
Retention vs. vanity metrics
Comparing retention data against surface-level numbers shows why sophisticated teams prioritize it. Follower counts and impressions tell you who showed up once. Retention tells you who's still there next month, which is the group that actually drives referrals, upgrades, and long-term brand authority.
| Metric | What it shows | Limitation |
|---|---|---|
| Follower/subscriber count | Total audience size | Includes inactive or one-time viewers |
| Views/impressions | Initial reach | No signal on repeat engagement |
| Retention rate | Percentage returning after X days | Requires cohort setup to interpret |
| Churn rate | Users lost over a period | Best read alongside retention curves |
Understanding these differences matters most for teams treating content as a business asset rather than a popularity contest. A founder building investor credibility or a business owner scaling market authority needs proof that an audience sticks around, not just that it noticed you once. That's the gap heap retention analysis is designed to close, and it's the same gap SocialRevver's growth architecture targets when turning short-form attention into measurable, recurring engagement.
How to run a retention analysis in Heap
Building your first retention report in Heap starts with defining the action that counts as a "start" event, like a first content view, sign-up, or purchase. Heap then tracks every user who completed that action and shows what percentage return to perform a second, defined action within your chosen time window. Getting this setup right matters more than any dashboard tweak that follows.
A retention report is only as useful as the starting event you choose to measure.
Setting up your first cohort
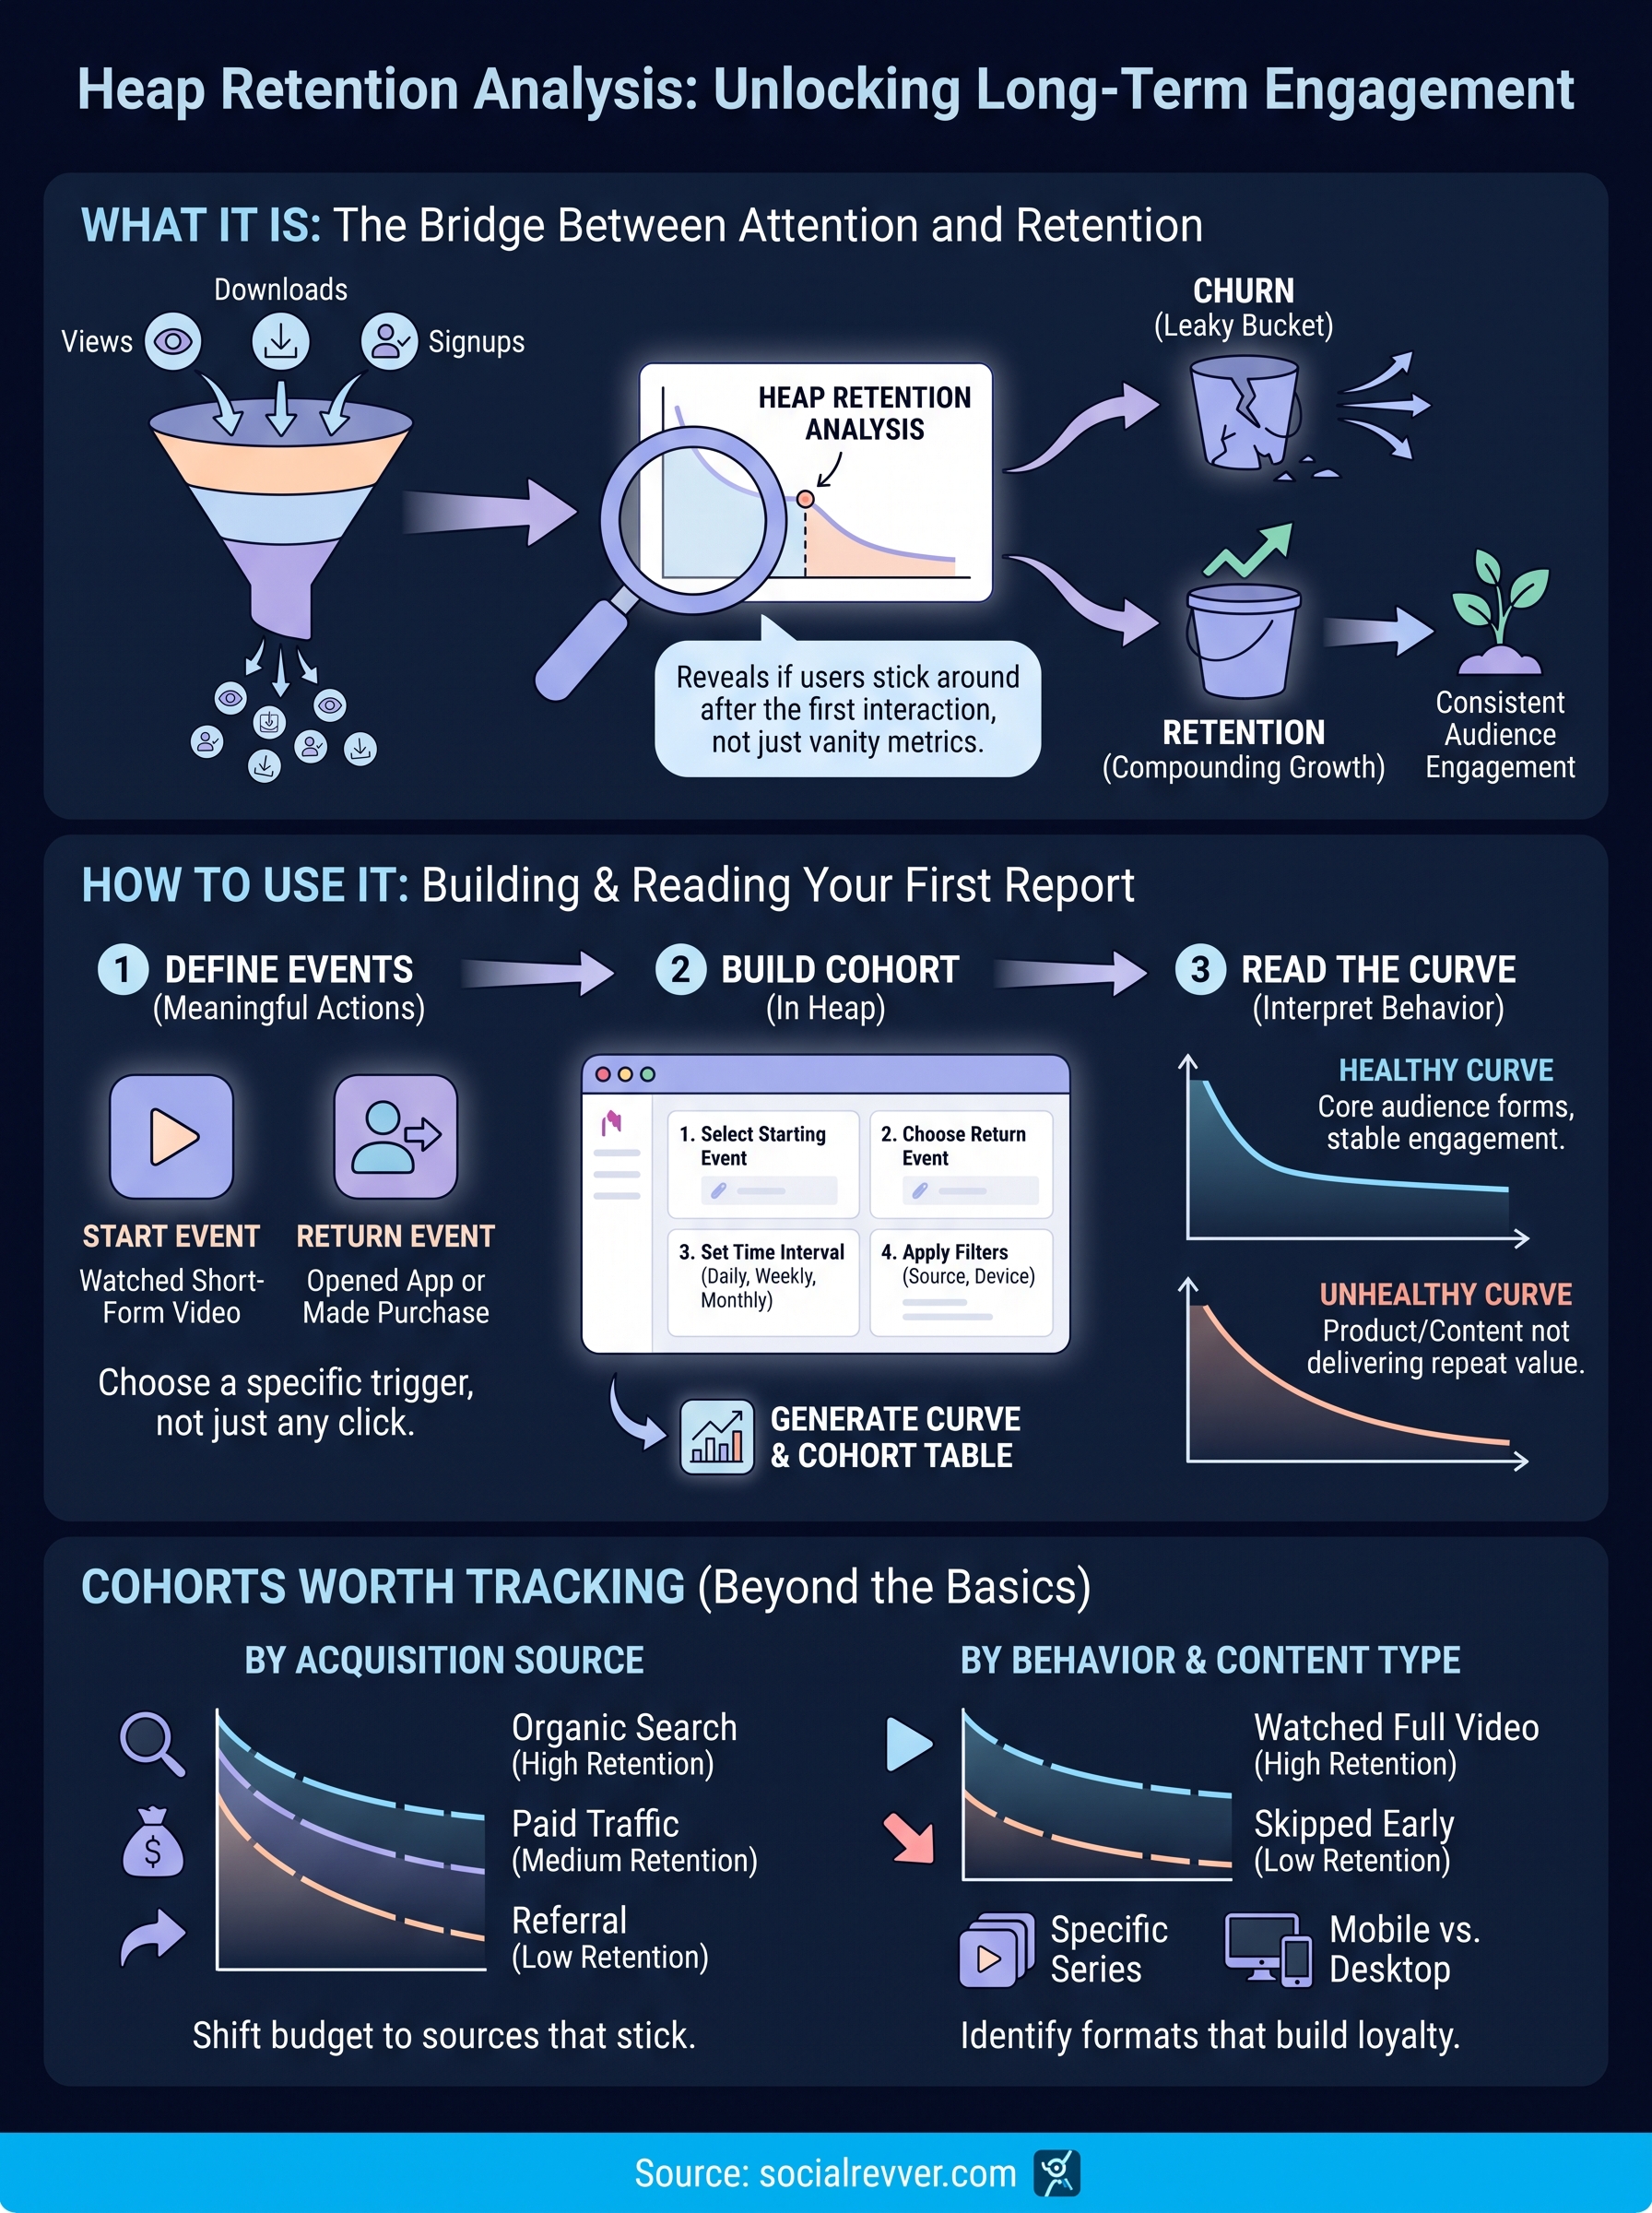
Start by picking a meaningful trigger event, not just any click. Then follow these steps inside Heap:
- Open the Retention analysis tool from your Heap workspace.
- Select the starting event (e.g., "Watched Short-Form Video").
- Choose the return event you want to measure (e.g., "Opened App" or "Made Purchase").
- Set your time interval: daily, weekly, or monthly.
- Apply any relevant filters or segments, such as traffic source or device type.
Heap generates a retention curve and a cohort table showing the percentage of users returning at each interval.
Reading the curve correctly
Interpreting the shape matters as much as building it. A steep early drop followed by a flattening line usually signals a healthy "core" audience forming, while a curve that keeps sliding toward zero suggests your product or content isn't delivering repeat value yet.
Retention cohorts worth tracking beyond the basics
Most teams stop at a single overall retention curve, but that view hides the segments actually driving your numbers. Cohort segmentation lets you compare how different groups of users behave after that first action, which reveals whether your growth is broad-based or propped up by one channel. Splitting cohorts by source, behavior, or content type turns a single line on a graph into a diagnostic tool you can actually act on.
A single retention curve tells you what happened. Segmented cohorts tell you why.
Segment by acquisition source
Source-based cohorts show whether paid traffic, organic search, or short-form content referrals stick around at different rates. If your organic short-form audience retains at twice the rate of paid clicks, that's a signal to shift budget and creative attention accordingly. Build these cohorts by filtering your starting event with a UTM or referral property before running the report.
Segment by behavior and content type
Behavioral cohorts group users by what they did first, not just where they came from. Consider tracking:
- Users who watched a full video versus those who skipped early
- Users who engaged with a specific content series or topic
- Users who took a secondary action, like clicking a link in bio
- Users on mobile versus desktop
These splits often expose which content formats or funnel entry points produce the loyal, repeat audience worth scaling further.
Common retention analysis mistakes to avoid
Even experienced growth teams misread retention data because the setup, not the dashboard, is where errors creep in. A cohort report can look precise and still lead you toward the wrong fix if the underlying event choices or sample sizes are off. Catching these mistakes early saves weeks of chasing the wrong lever.
Choosing the wrong starting event
Picking a starting event that's too broad, like "visited site," muddies every cohort that follows because it mixes casual browsers with genuinely interested users. Anchor your retention report to a meaningful action instead, such as watching a full video or completing a first purchase, so the resulting curve reflects real engagement rather than noise.
A vague starting event guarantees a vague retention curve.
Ignoring cohort size and time windows
Small cohorts produce curves that swing wildly from one week to the next, tempting teams to overreact to statistical noise instead of a real trend. Watch for these common setup errors:
- Drawing conclusions from cohorts under 100 users
- Comparing weekly and monthly windows side by side
- Skipping seasonality checks around holidays or launches
- Ignoring outlier spikes from a single viral post
Growing your sample size before acting on a dip, and keeping your time interval consistent across comparisons, keeps the analysis honest and prevents costly, premature pivots based on a handful of unusual users.
Putting retention data to work
Running a heap retention analysis only pays off once you act on what the curves show you. Spotting a drop-off at day three means testing a new hook or follow-up sequence right at that point, not waiting for next quarter's review. Tracking cohorts by source and content type means shifting budget toward what actually keeps people around, not what just got the most initial views.
Sophisticated founders and business owners don't treat retention as a report to file away. They treat it as the feedback loop that separates a real attention engine from a lucky viral moment. If you want that loop built and monitored for you, backed by data from over 750,000 videos instead of guesswork, get your free 40+ slide social media strategy and see exactly where your audience is dropping off, and how to fix it.