
Posting content without tracking what's working is like running ads with no conversion data, you're spending time and resources blind. Buffer analytics gives social media managers and business owners a way to measure post performance across platforms, spot trends, and generate reports that actually inform decisions. It's one of the most accessible analytics tools on the market, but whether it's the right fit depends on your goals and how deep you need to go.
At SocialRevver, we build data-driven content systems that turn short-form video into a predictable growth engine. Our Attention Engine™ runs on performance data, the kind of metrics tools like Buffer surface. Understanding how analytics platforms work, and where they fall short, matters if you're serious about converting organic attention into revenue rather than just watching numbers tick up.
This article breaks down Buffer's analytics features, the types of reports you can pull, current pricing, and how the tool actually works in practice. Whether you're evaluating Buffer for the first time or comparing it against more advanced options, you'll walk away with a clear picture of what it offers and where it fits in a larger content strategy.
Why Buffer Analytics matters for social reporting
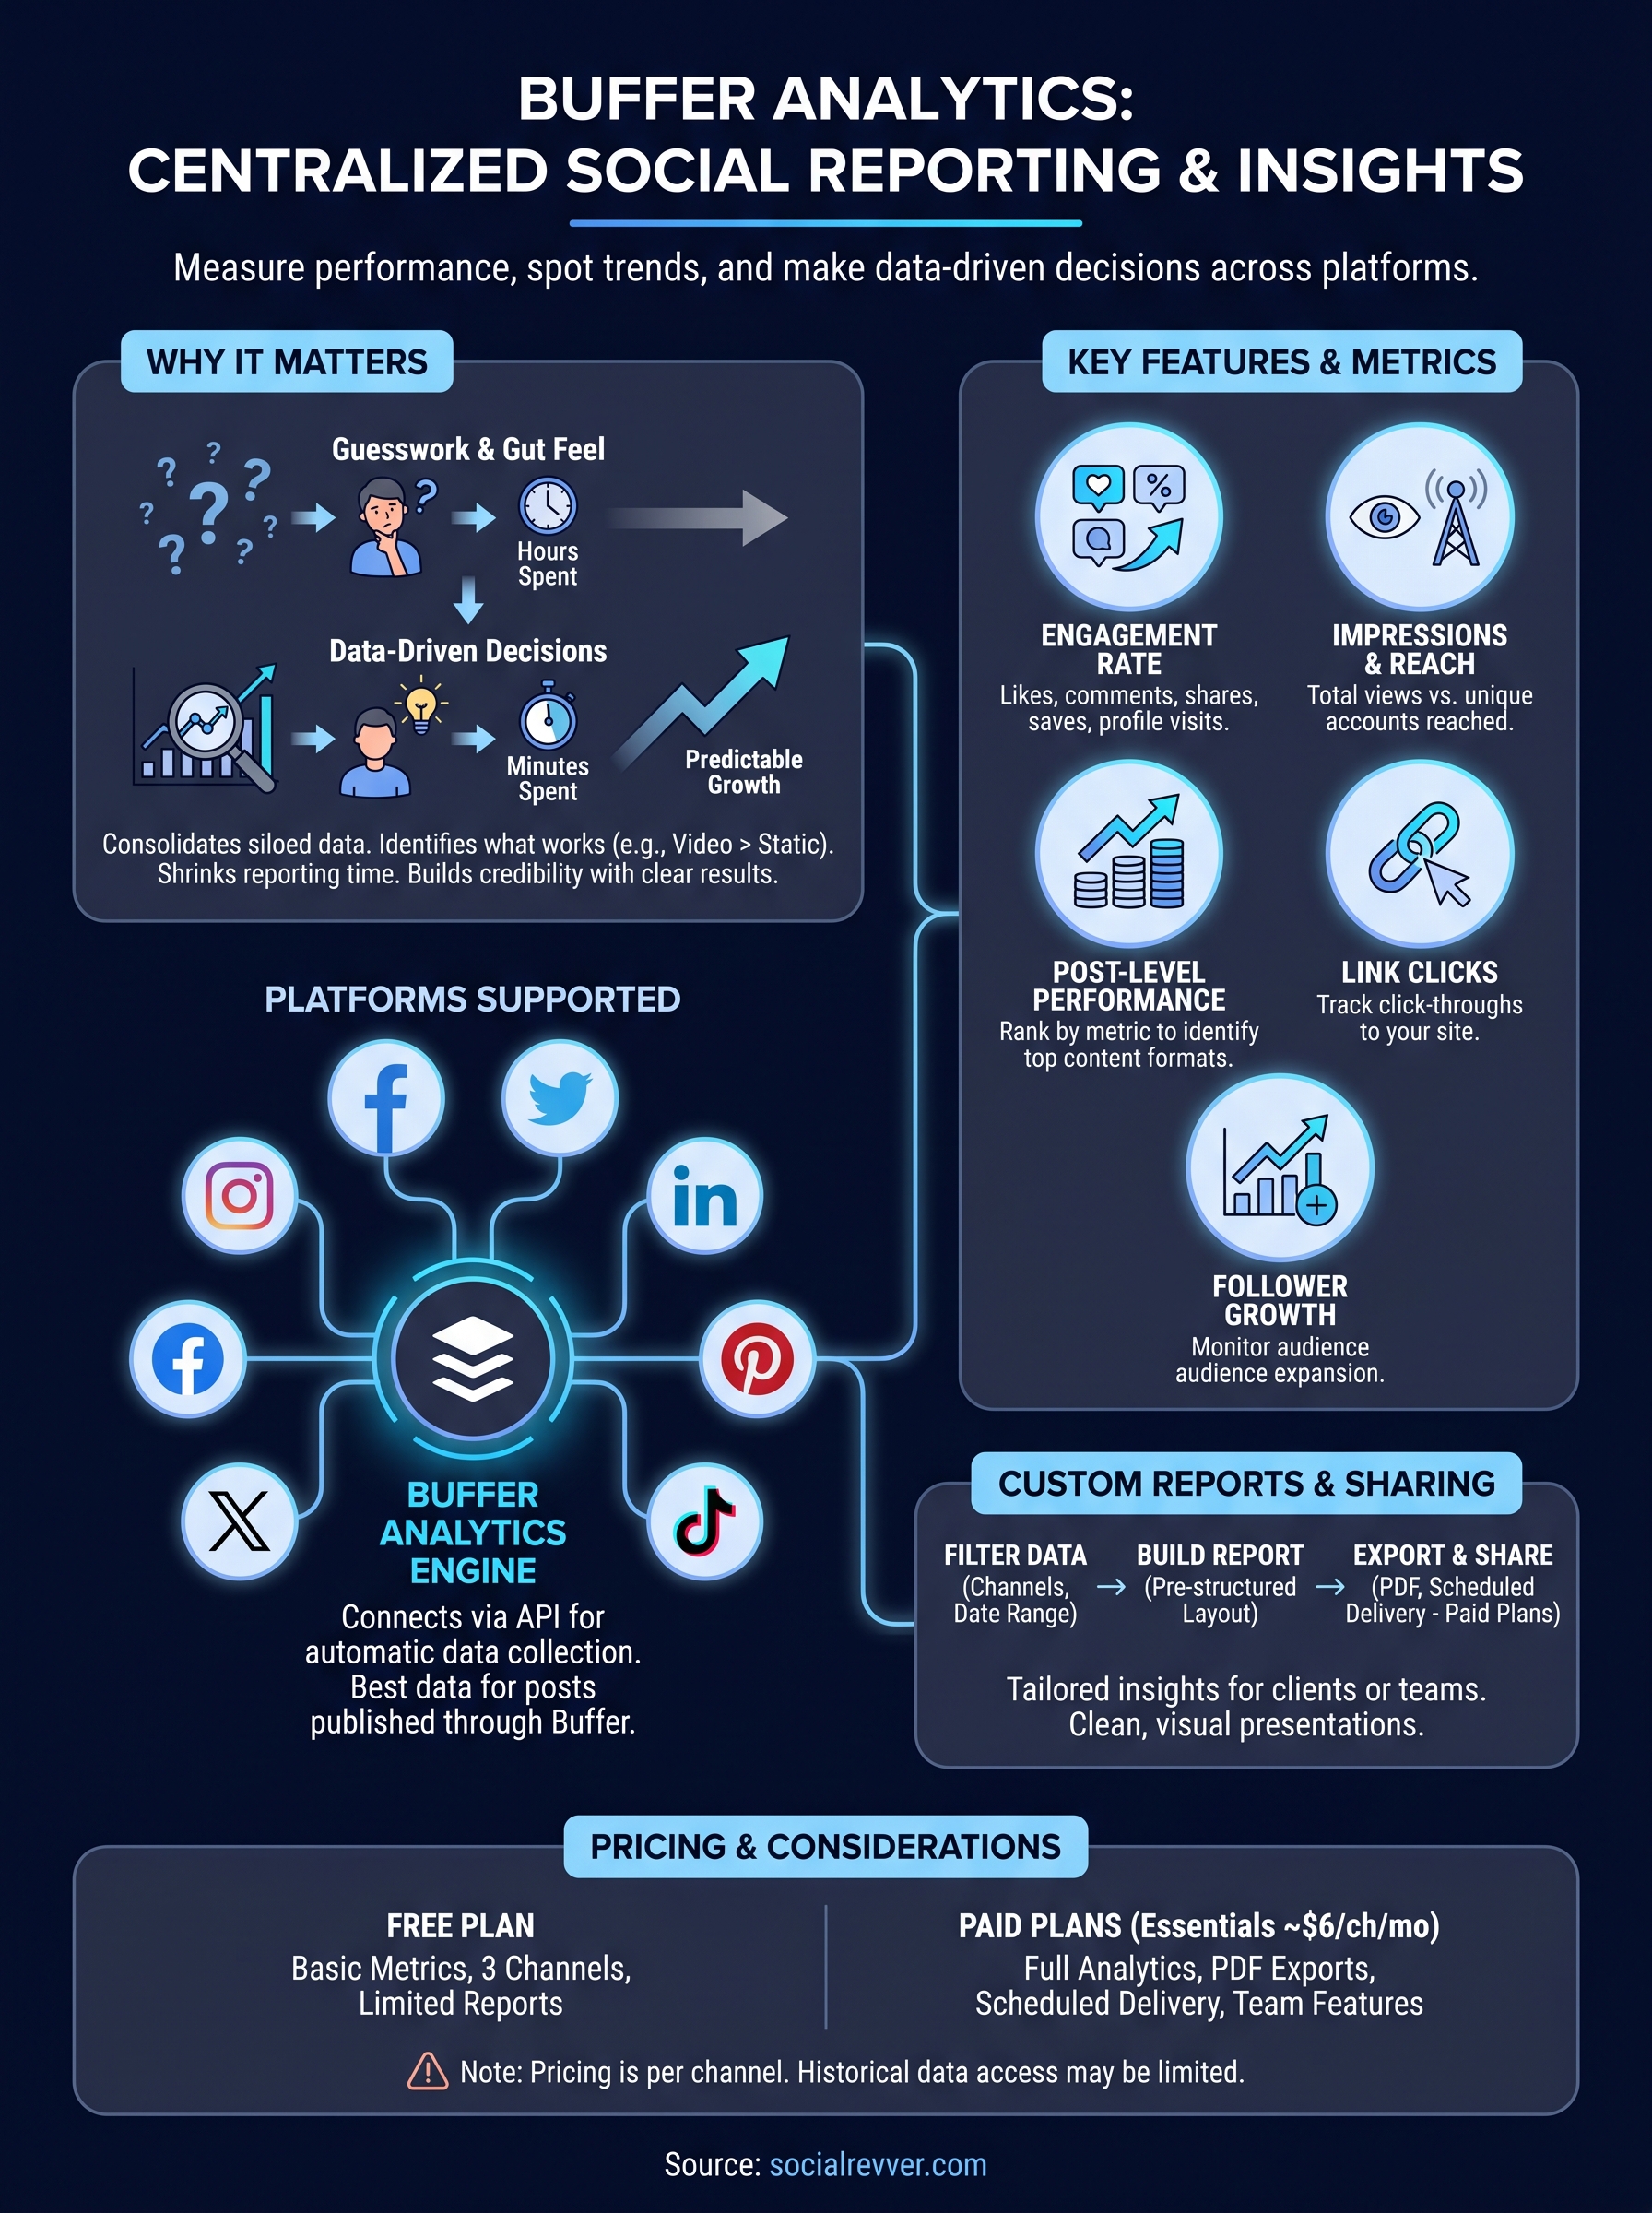
Most social media managers spend hours creating content without a clear system for knowing what actually works. Buffer analytics changes that by pulling performance data from multiple platforms into one interface, so you can compare results without jumping between native dashboards. When you have clear, centralized data, you stop guessing and start making content decisions based on evidence rather than instinct.
The cost of skipping analytics
Without a reporting layer, you're making decisions based on gut feel. You might notice one post got more likes than usual, but you won't know whether that spike came from the topic, the format, the posting time, or a lucky reshare. Consistent analytics practice is what separates teams that grow predictably from those stuck in a cycle of creating and hoping. Each post you publish is a data point, and without tracking it, that signal disappears the moment it leaves your feed.
The difference between a content strategy and a content guess is whether you measure outcomes.
Platform-native analytics (like Instagram Insights or LinkedIn Analytics) give you some of this data, but they're siloed. You'd have to manually pull reports from each platform, line up the numbers in a spreadsheet, and do your own cross-platform interpretation. That process eats time and introduces errors, especially when you're managing multiple accounts or reporting to someone else.
Why centralized reporting gives you leverage
When you consolidate performance data in one place, patterns become easier to identify and act on. You can see that video content consistently outperforms static images for your audience on one platform, while link posts still drive strong click-throughs on another. Those insights directly shape your next production cycle before you waste time repeating formats that don't convert.
Buffer analytics aggregates this data for you, which means your reporting workflow shrinks from hours to minutes. For business owners who are already stretched thin on time, that efficiency is not a small thing. You get a single view of how your content performs across the platforms you're active on, without needing a dedicated analyst or a complex data infrastructure to support it.
Social reporting also becomes more valuable when you can share it clearly. Whether you're presenting results to a founder, a client, or your own internal team, a clean report showing trend lines, top-performing posts, and engagement rates builds credibility for your strategy. Concrete data either confirms your approach is working or tells you exactly where to course-correct, both outcomes are useful.
How Buffer Analytics works across platforms
Buffer analytics connects to your social accounts through authorized API integrations. You grant Buffer access to each platform, and it starts pulling performance data automatically once that connection is live. The tool currently supports Instagram, Facebook, Twitter/X, LinkedIn, Pinterest, and TikTok, giving you a consolidated view from a single dashboard rather than requiring separate logins for each network.
Connecting your accounts and pulling data
Once you link an account, Buffer collects engagement metrics, reach data, and post-level performance for content published through the platform. Data from posts published outside of Buffer may be limited depending on each platform's API restrictions, so routing your publishing through Buffer directly gives you the most complete and reliable data set. You can also manage multiple accounts per platform, which matters if you run several brand profiles or handle client accounts simultaneously.
The more consistently you publish through Buffer, the more complete and actionable your analytics data becomes over time.
Each platform exposes slightly different native metrics based on what its API makes available, so some data points vary between networks. You'll notice that TikTok and Pinterest tend to surface less granular data than Instagram or LinkedIn within the Buffer dashboard, and that's a function of what those platforms allow third-party tools to access rather than a Buffer limitation.
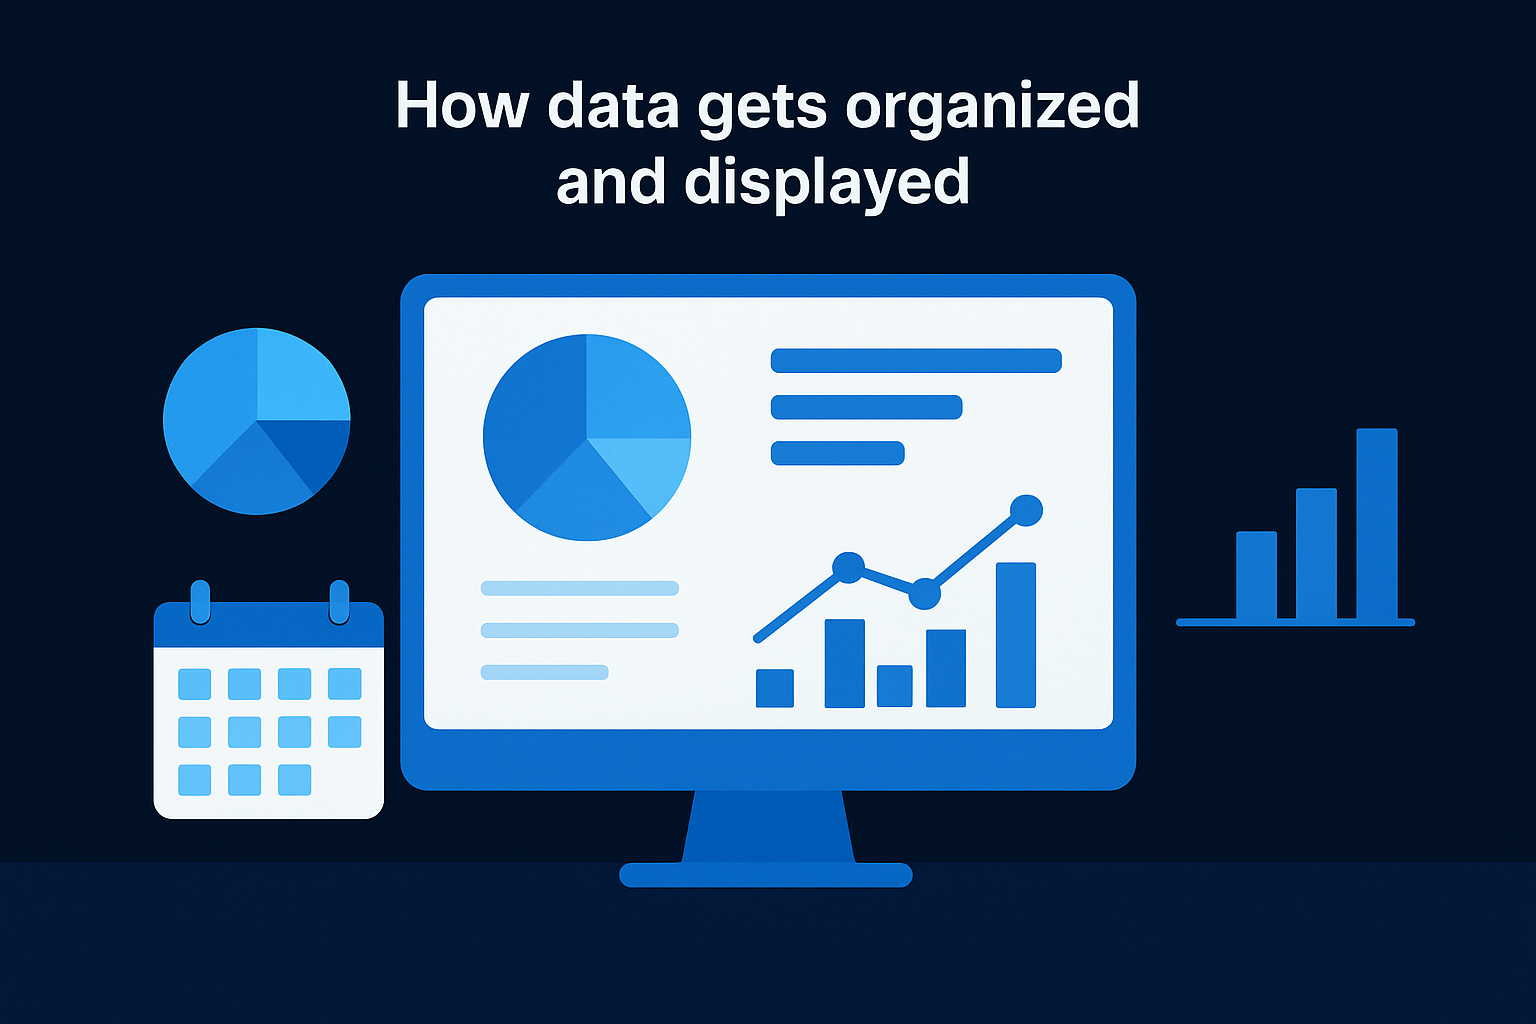
How data gets organized and displayed
Buffer organizes your performance data by channel, date range, and post type, making it straightforward to filter results and zero in on specific time windows. The dashboard surfaces aggregate metrics at the top, such as total impressions and follower growth, then lets you drill down to individual post performance below. Comparative views across platforms are available on higher-tier plans, which lets you see whether the same content style performs differently depending on where you post it.
Key features and metrics inside Buffer Analytics
Buffer analytics gives you a layered view of performance that goes beyond a simple like count. The core dashboard surfaces engagement rate, impressions, reach, link clicks, and follower growth in one place, so you can assess whether your content is building genuine traction or just generating passive scrolls. These metrics update automatically as your posts accumulate data, which means you're always working with current numbers rather than a static snapshot you pulled last week.
Engagement and reach metrics
Engagement metrics tell you how your audience is actually interacting with your content, not just how many people saw it. Inside Buffer, you can track likes, comments, shares, saves, and profile visits at the individual post level, which makes it easy to identify which specific pieces of content drove the highest interaction rates. Reach data shows you the total number of unique accounts that saw each post, and comparing reach against engagement gives you a clearer read on what your audience responds to versus what they scroll past.
High reach with low engagement usually signals a mismatch between your content and your audience's expectations.
Post-level performance and top content
One of the more practical features in Buffer's analytics suite is the ability to sort posts by performance metric across a selected date range. You can rank your content by engagement rate, impressions, or clicks, then look at what the top-performing posts share in common. That process, reviewing format, topic, length, and posting time for your best content, gives you a repeatable feedback loop. Rather than treating each post as a standalone effort, you start building a picture of what your specific audience actually wants to see more of.
How to create custom reports and share insights
Buffer analytics lets you build reports tailored to specific time ranges, platforms, and metrics, so what you share reflects your actual goals rather than a generic summary. From the reporting tab, you select the accounts and date range you want to cover, and Buffer compiles the data into a structured view you can customize before exporting or sending.
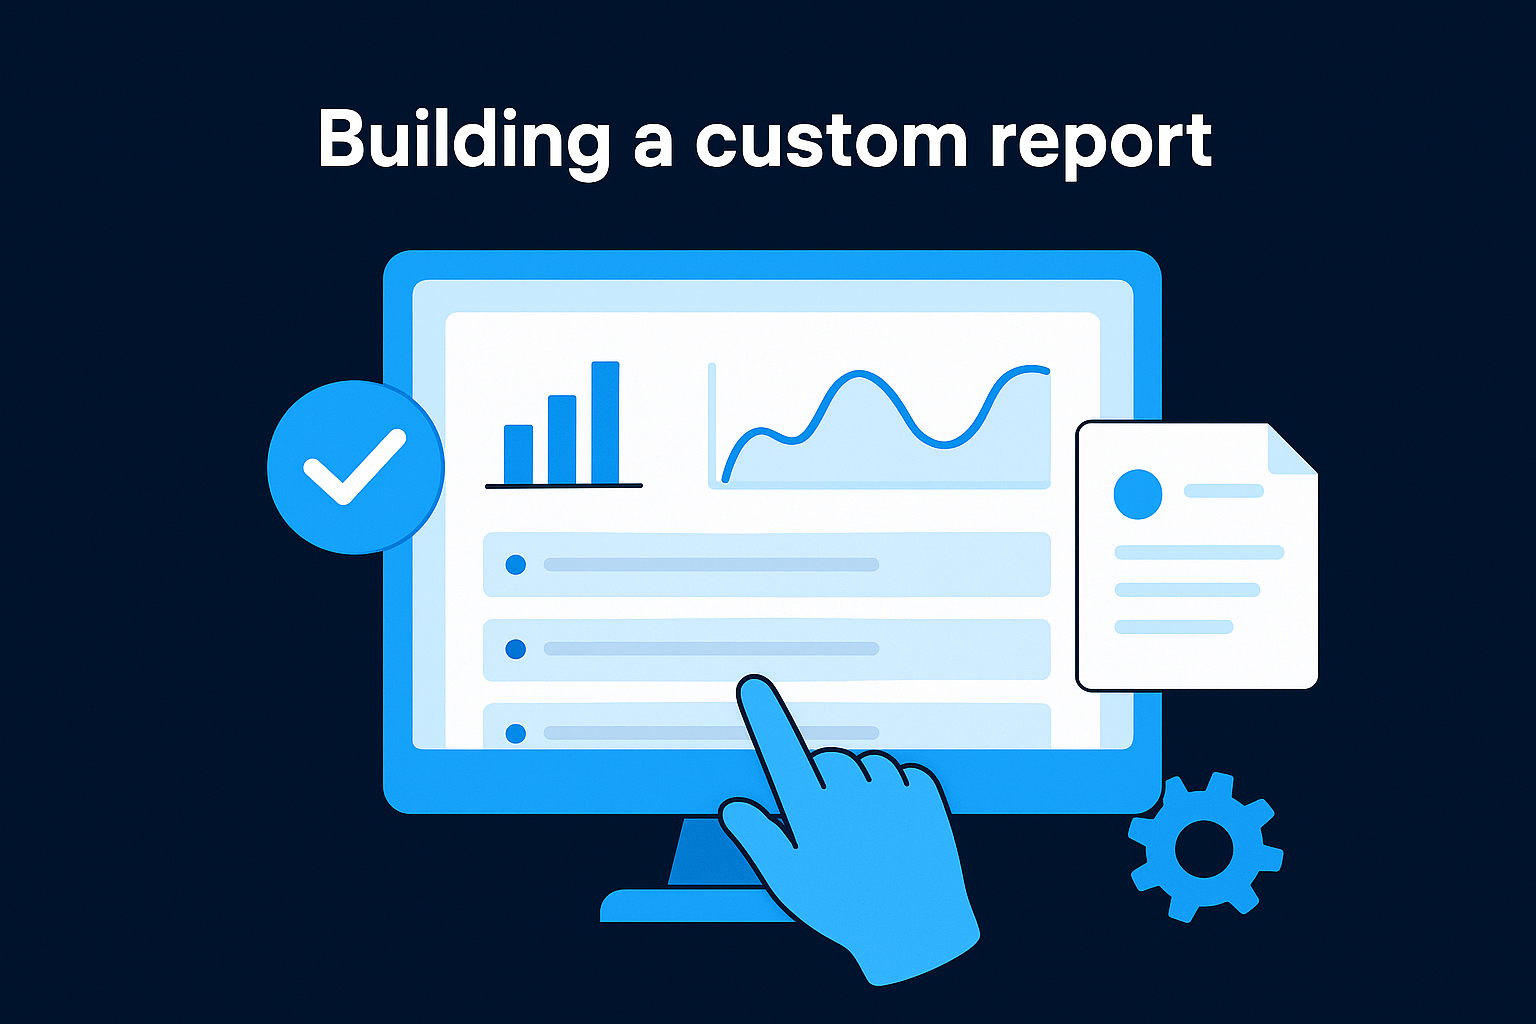
Building a custom report
When you create a report inside Buffer, you start by choosing which channels and metrics to include. You can pull data from a single platform or combine multiple accounts into one report, depending on whether you need a focused channel view or a broader cross-platform picture. Once you've set your filters, Buffer surfaces the relevant engagement, reach, and top post data in a format that's already organized for presentation. You're not manually assembling cells in a spreadsheet; the layout comes pre-structured, which cuts your reporting time significantly.
A focused report built around a clear question, like which post format drove the most profile visits this month, is more useful than a generic data dump.
Exporting and sharing your data
Buffer allows you to export reports as PDF files, which makes sharing straightforward whether you're presenting to a client, a founder, or your own team. The exported report includes charts and key metrics in a clean visual layout, so the recipient can read it without needing access to your Buffer account. For teams on higher-tier plans, scheduled report delivery is available, meaning Buffer can send reports automatically on a recurring basis without you triggering each one manually. That feature removes the task entirely from your plate, which matters when reporting is a regular commitment.
Buffer Analytics pricing and what to expect
Buffer analytics sits inside Buffer's broader subscription tiers, so the depth of data you can access depends on the plan you're on. The free plan gives you basic post metrics for up to three channels, but you won't get access to full reporting features or exportable reports at that level. If analytics is a core part of why you're using Buffer, you'll need a paid plan to unlock the full functionality.
Plans and what each tier unlocks
Buffer's paid options scale from Essentials at around $6 per channel per month up through Team and Agency tiers. The Essentials plan gives you complete access to analytics and reporting for your connected channels, including post-level data, engagement breakdowns, and PDF exports. The Team plan adds collaboration features like draft approvals and user permissions, while the Agency plan is built for managing a large volume of channels across multiple clients. Each step up adds operational features more than it deepens the analytics layer, so most solo operators and small teams will find Essentials covers the reporting side adequately.
Paying per channel means costs can add up quickly if you manage many accounts, so audit which channels you actively publish to before subscribing.
What to watch for before you commit
The per-channel pricing model is worth calculating carefully before you sign up. If you manage five or more active channels, the monthly cost starts to compound, and you may find that an all-in-one platform with a flat fee delivers better value at that scale. Buffer also limits historical data access based on your plan, so if you need to pull reports from a year ago, verify your tier covers that window before you rely on it for long-term trend analysis.
Where to go from here
Buffer analytics gives you a solid foundation for understanding how your content performs across platforms, and that visibility is genuinely useful. You can track engagement, identify your top posts, build clean exportable reports, and connect data across multiple channels without rebuilding your workflow from scratch. For teams that need straightforward reporting without a heavy setup, Buffer delivers on that promise at a reasonable entry price.
Where it starts to show limits is when your goal moves beyond tracking to actual revenue growth. Knowing which post got the most reach is useful, but turning that attention into inbound leads, brand authority, and consistent business results requires a system built around conversion, not just measurement. If that gap sounds familiar, you're not alone.
If you want to see what a data-driven content system looks like when it's engineered for growth, get your free 40+ slide social media strategy from the SocialRevver team.