
You're driving traffic to your landing page, but the leads never show up. Somewhere between the click and the conversion, people vanish, and without visibility into that path, you're guessing at fixes instead of making them. Hotjar funnel analysis solves that blind spot by mapping every step a visitor takes and showing you exactly where they give up.
This guide walks through how Hotjar's Funnels feature actually works: setting up a funnel from your key pages, reading the drop-off percentages at each stage, and layering in session recordings and heatmaps to see the actual behavior behind the numbers. You'll learn how to spot a leaky form, a confusing CTA, or a slow-loading step before it costs you another month of wasted ad spend.
We build attention systems for founders and creators who treat growth like an engineering problem, not a guessing game. The same logic applies here: funnel data turns vague frustration into a fixable list. By the end of this guide, you'll know how to turn Hotjar's funnel reports into a repeatable fix-it process, so every campaign you run gets a little tighter than the last.
What is Hotjar funnel analysis?
Funnel analysis is the practice of tracking visitors through a defined sequence of pages or actions, then measuring how many people make it from one step to the next. Hotjar's Funnels tool does this automatically once you define the steps, showing you a visual chart with the number and percentage of visitors who dropped off at each stage. Instead of guessing whether your checkout page or your signup form is the problem, you get a hard number: 1,000 visitors hit your landing page, 400 clicked "start," and only 90 finished the form. That gap between 400 and 90 is where you focus your attention.
Why this matters more than pageviews
Most analytics tools tell you how many people visited a page. Funnel data tells you what they did once they got there, and more importantly, where they stopped doing it. A landing page with 10,000 visits a month sounds healthy until you realize 96% of those people never reach your pricing page. Hotjar's funnel view surfaces that number instantly, without you having to stitch together separate reports from Google Analytics 4 or manually cross-reference event tracking.
A funnel report doesn't just show you traffic, it shows you exactly where your traffic gives up.
How it differs from heatmaps and recordings
Hotjar offers several tools, and it helps to know what each one is actually built for. Funnels answer the "where" question: which step is bleeding visitors. Heatmaps and session recordings answer the "why": what did that person actually do, click, or ignore before they left. You need both. A funnel without behavioral context tells you there's a problem on your checkout page but not whether it's a broken button, a confusing shipping fee, or a form field nobody wants to fill out.
Who benefits most from this approach
Business owners running paid campaigns, SaaS founders tracking trial-to-paid conversion, and creators funneling followers into email lists all lean on this kind of visibility. If you're spending money to get eyes on a page, you owe it to your budget to know exactly where those eyes stop looking. Google's own guidance on measuring conversions backs this up: understanding the full path matters as much as counting the final result, as outlined in Google's Analytics documentation on conversion tracking (https://support.google.com/analytics/answer/9267735).
Step 1. Map your conversion goal and funnel steps
Before you touch the Hotjar dashboard, decide what actually counts as a win. Mapping your funnel starts on paper, not in software, because a funnel built around the wrong goal wastes weeks of data collection. Are you tracking free trial signups, demo bookings, or completed checkouts? Pick one primary conversion event and stick with it for this analysis.
Define the end goal first
Start by writing down the exact URL or action that marks a completed conversion, like a /thank-you page or a confirmation modal. This becomes the last step in your funnel, and everything else works backward from it. Vague goals produce vague funnels, so be specific about what "success" looks like on your site.
If you can't name the exact page that proves a conversion happened, your funnel isn't ready to build yet.
List every step in between
Once your endpoint is locked in, list every page or click a visitor has to pass through to get there. A typical lead-gen funnel might look like this:
- Landing page visit
- CTA button click
- Form page view
- Form submission (goal)
Keep the list short. Four or five steps is usually enough; anything longer buries the real problem in noise. Overcomplicating this stage makes the drop-off data harder to read later, not easier.
Step 2. Build your funnel in Hotjar
With your steps mapped out on paper, it's time to configure the actual Hotjar funnel inside the dashboard. Open your Hotjar site, navigate to the Funnels tool, and click to create a new funnel. You'll enter each step as either a URL match or a click event, in the exact order visitors experience them.
Set up each step correctly
Hotjar lets you define steps by URL contains, URL matches exactly, or a specific click target. For most lead-gen or checkout funnels, URL-based steps work best because they're easier to verify and less likely to break if your site's layout changes.
Step 1: URL contains /landing-page
Step 2: URL contains /pricing
Step 3: URL contains /checkout
Step 4: URL contains /thank-you (goal)
Double check spelling and trailing slashes. A single typo in a URL rule will silently break your entire funnel, and you won't notice until the data looks wrong weeks later.
A funnel is only as accurate as the URL rules you type into it, so verify every step before you trust the numbers.
Set the date range and let data collect
After saving, set your date range to the current week or month, then leave it alone. Hotjar only counts traffic from the moment you activate the funnel forward, so don't expect historical data to backfill. Give it at least a few hundred sessions before drawing conclusions. Low-traffic pages need more time to produce a sample size worth trusting, so resist the urge to judge results after just a day or two.
Step 3. Pinpoint drop-off points and segment results
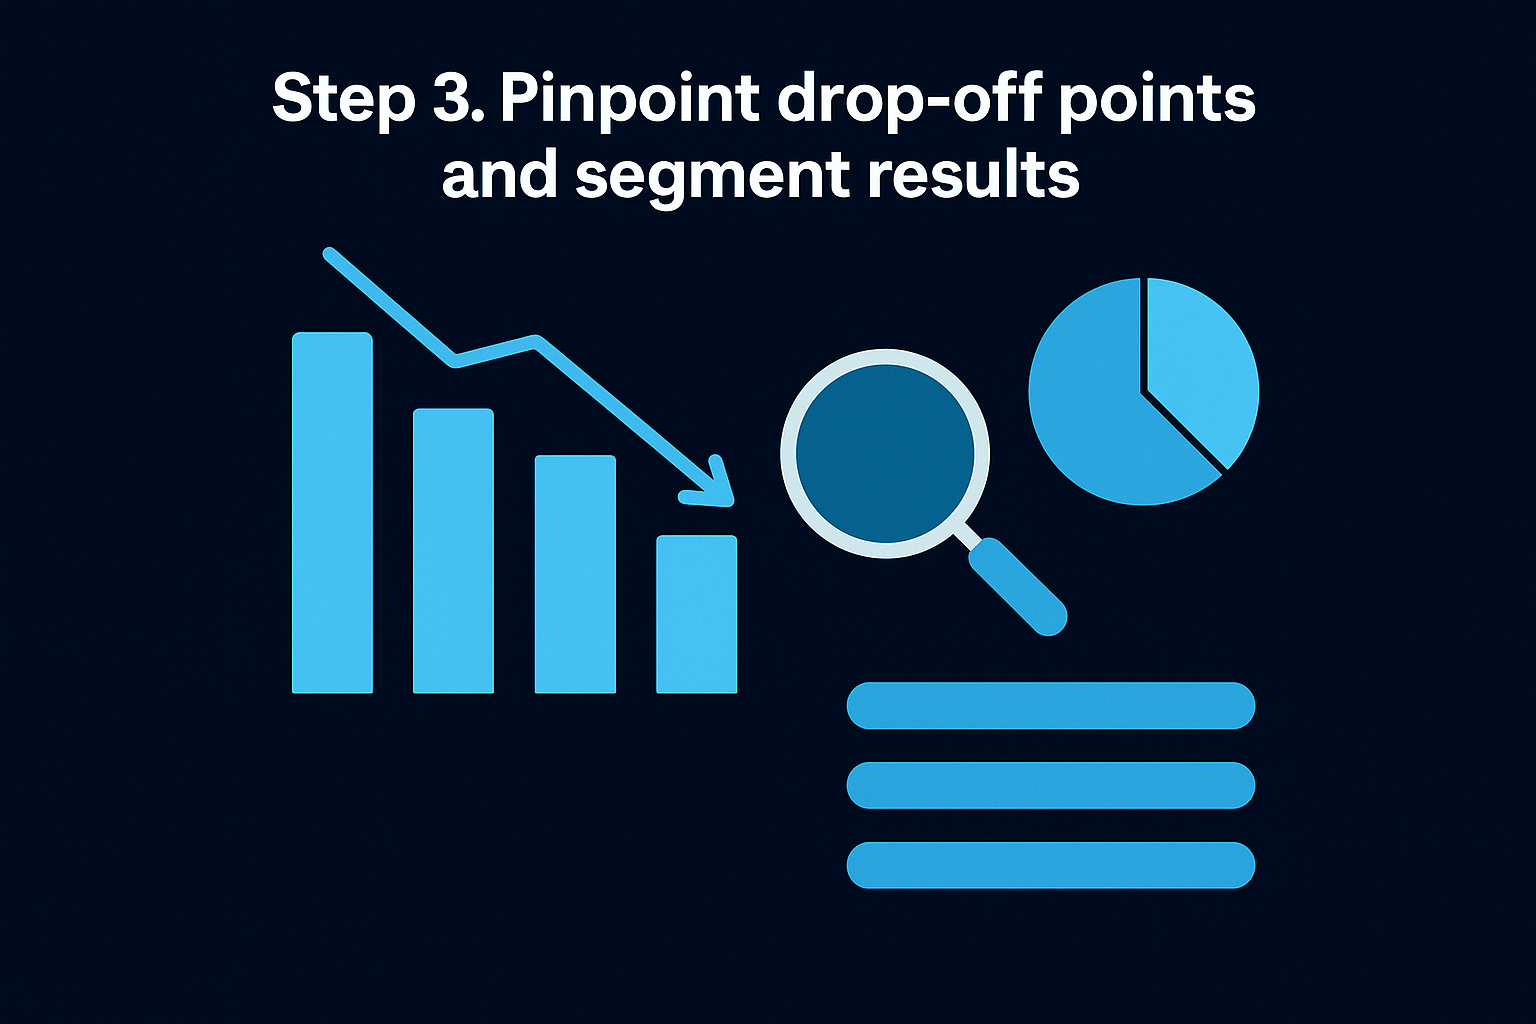
Once your funnel has enough sessions logged, Hotjar displays a bar chart showing the visitor count and percentage drop at every step. Reading drop-off points correctly means looking for the biggest percentage decline between two adjacent steps, not the biggest raw number. A drop from 5,000 to 4,800 visitors barely matters, but a drop from 800 to 200 on your checkout page is a five-alarm fire.
Find the steepest drop first
Scan the chart left to right and flag the single largest percentage loss. That's your priority, not the step with the most total traffic. Fixing a 70% drop-off on your form page will move the needle far more than tweaking a landing page that's already converting well.
Chase the steepest percentage drop, not the biggest number, and you'll fix the right problem first.
Segment by device, source, and browser
Hotjar lets you filter funnel results by device type, traffic source, browser, and country. Segmenting almost always reveals a pattern the aggregate numbers hide.
- Mobile visitors dropping off at a form step that's hard to tap through
- Paid traffic converting worse than organic, hinting at a mismatched landing page
- Safari users stalling where Chrome users sail through, pointing to a rendering bug
Compare segments side by side before assuming your whole funnel is broken. Often it's one specific slice, say, mobile Safari users from a Facebook ad, causing most of the damage while everyone else converts fine. Isolating that segment tells you exactly where to spend your fix-it time next.
Step 4. Diagnose and fix drop-offs with heatmaps and recordings
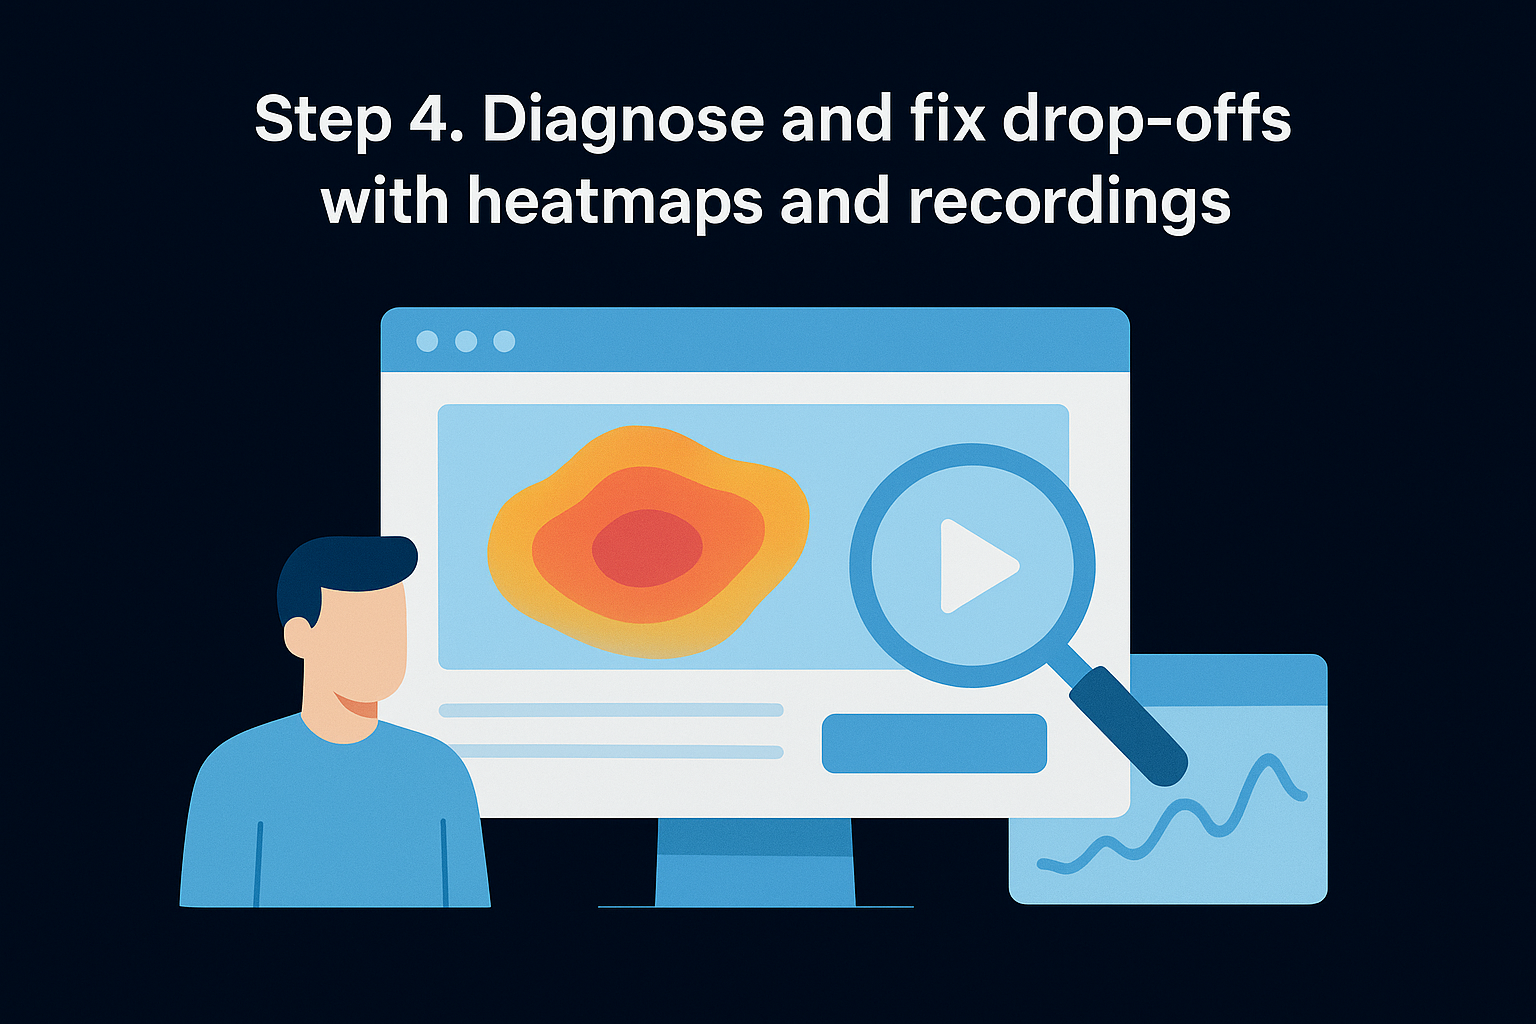
Numbers tell you where people quit, but they never tell you why. Once you've flagged the step with the steepest drop, pull up Hotjar's session recordings filtered to that exact page. Watch ten to fifteen sessions from visitors who reached that step but didn't move forward. You're looking for hesitation: repeated scrolling, hovering over a button without clicking, or abandoning a form mid-field.
Watch recordings for hesitation patterns
Recordings expose the friction that raw percentages can't. Maybe visitors scroll past your CTA because it looks like decoration, not a button. Maybe they open a form, hit a required field asking for a phone number, and close the tab. Session recordings turn an abstract drop-off into a specific, fixable moment you can point to in a team meeting.
A single recording of a confused visitor often explains more than a thousand rows of funnel data.
Cross-reference with heatmaps
Layer in a click heatmap for the same page to confirm what recordings suggest. If nobody's clicking your primary CTA but everyone's clicking a decorative image nearby, you've found your fix: swap their visual weight. Scroll maps also reveal if key content sits below where most visitors actually scroll.
Ship one fix, then retest
Change one thing at a time, whether that's shortening a form, rewording a CTA, or moving a button above the fold. Let the funnel run again for a week, then compare the new drop-off rate against your baseline before making another change.
Making funnel analysis a habit
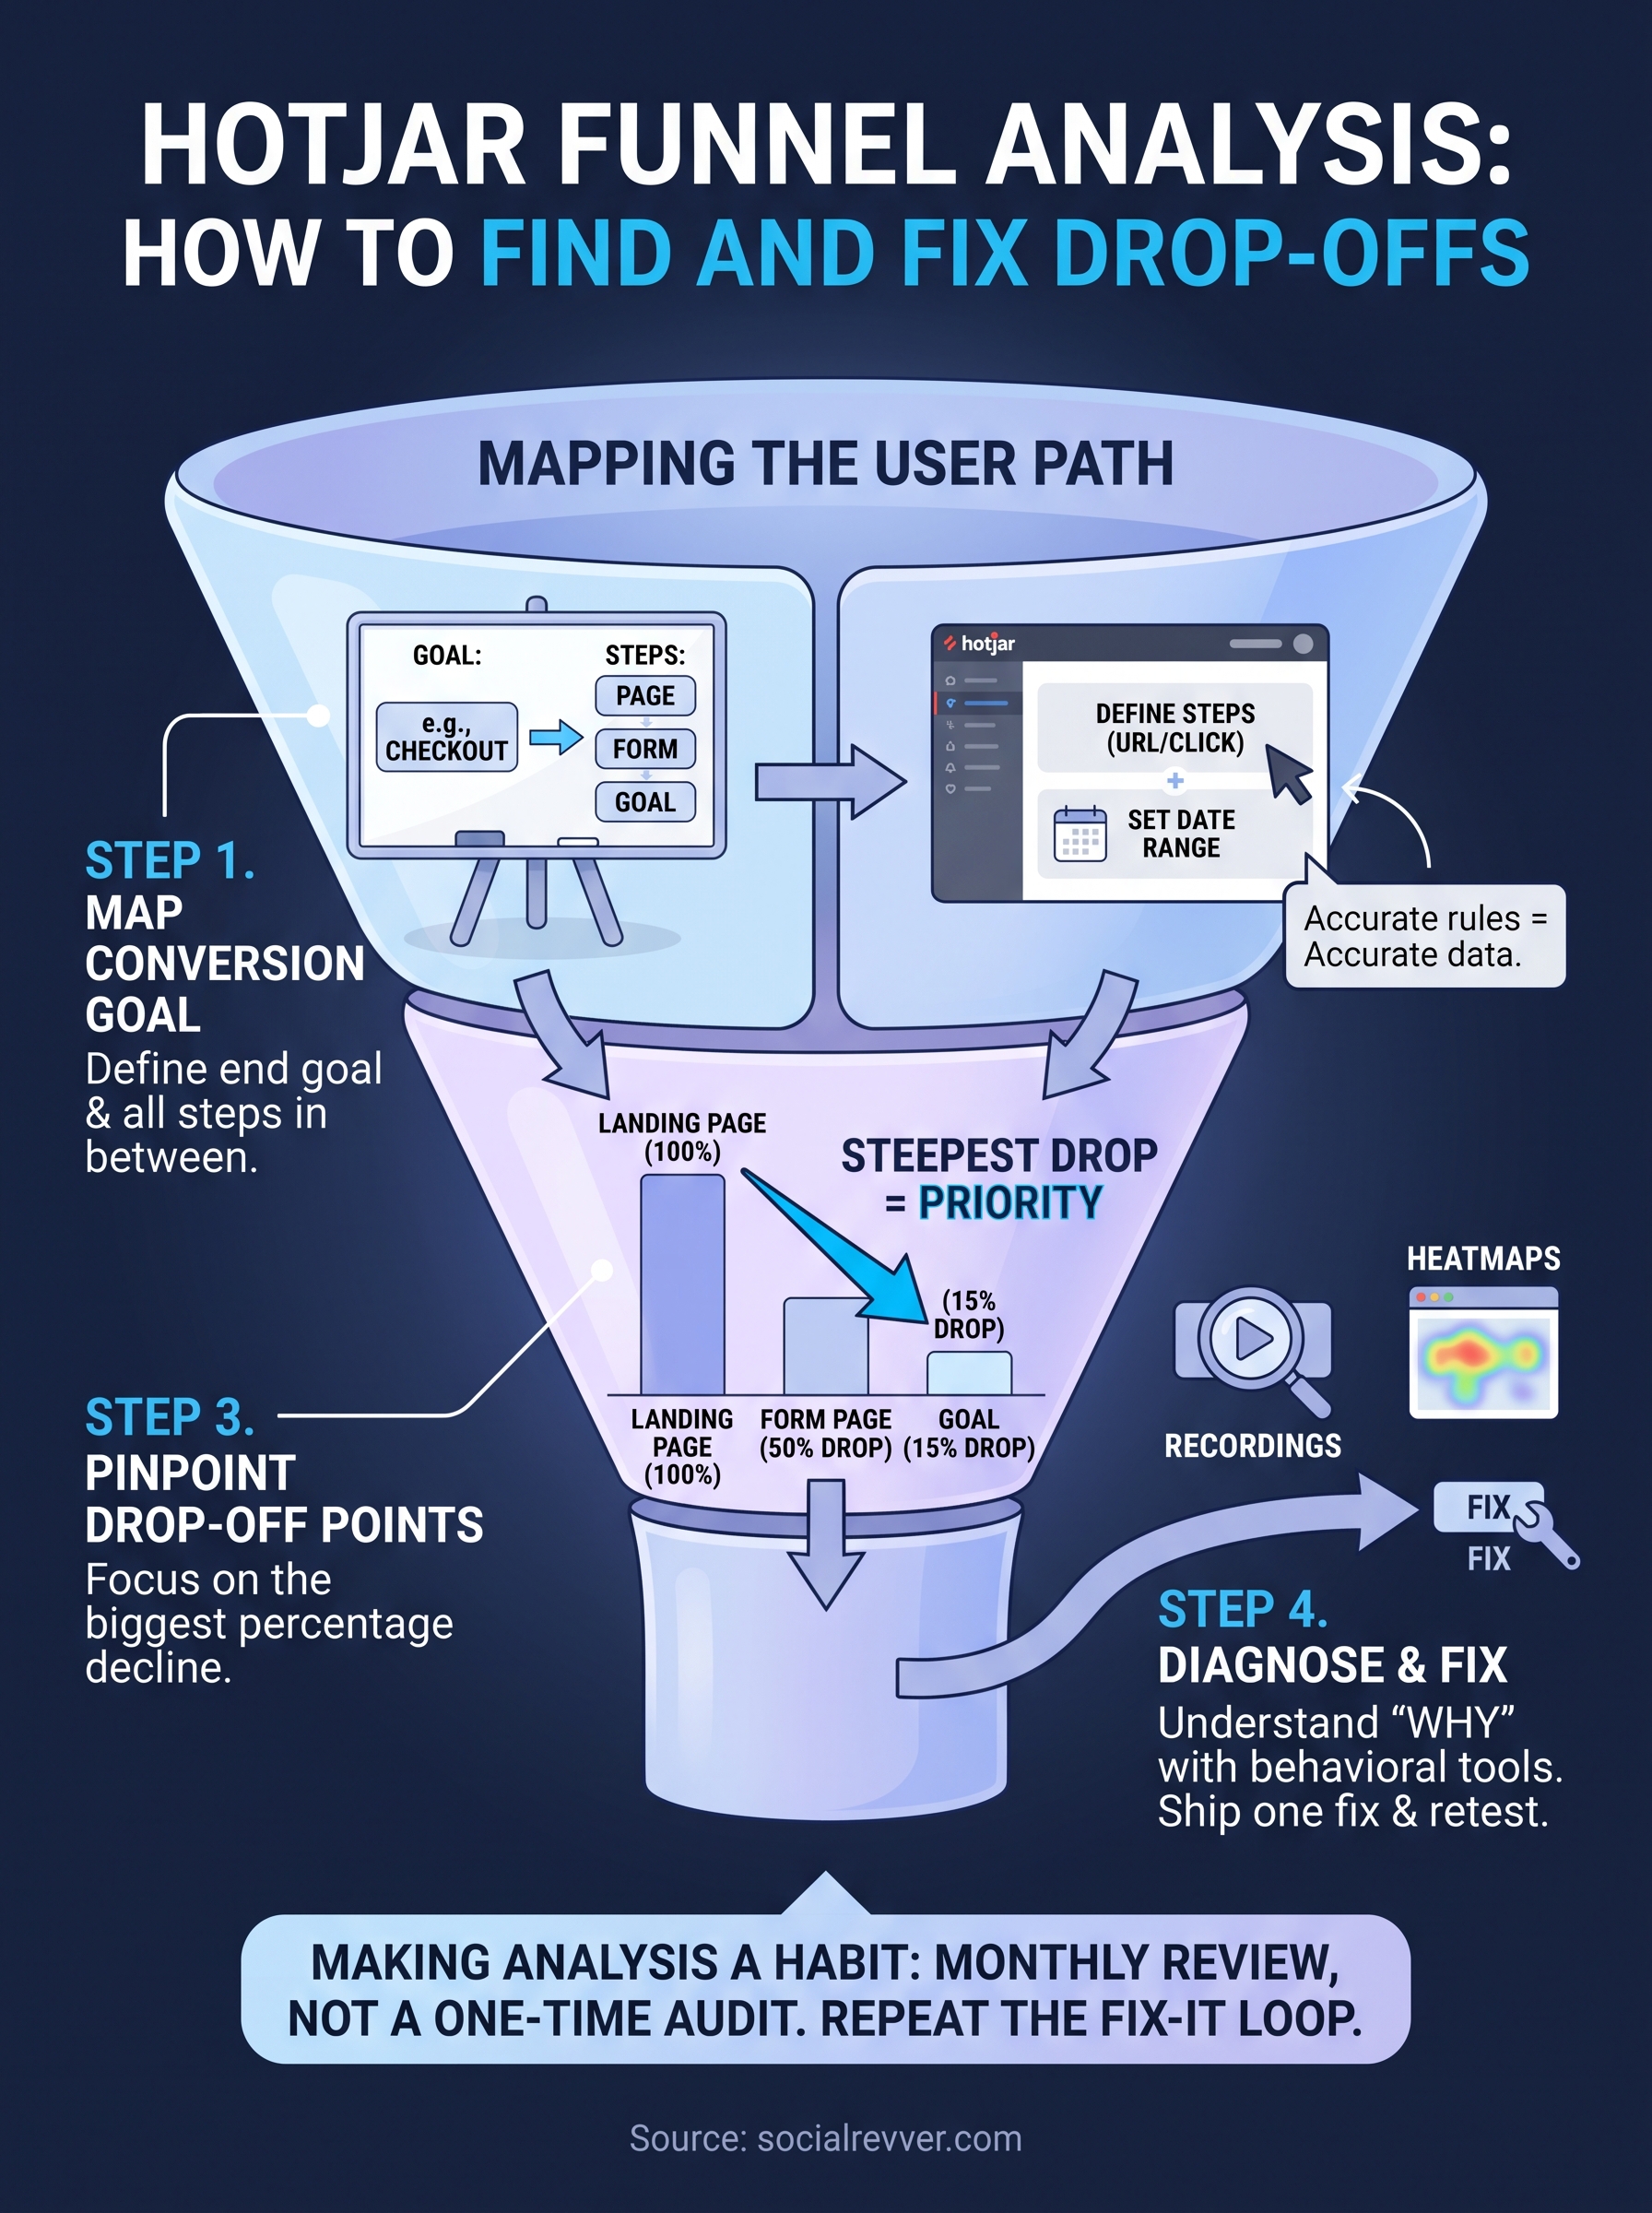
One funnel check won't fix your conversion problem for good. Traffic sources shift, browsers update, and the mobile checkout that worked fine last quarter might be losing 30% of visitors today. Hotjar funnel analysis only pays off when you treat it like a monthly review, not a one-time audit. Set a recurring calendar reminder to pull up your funnel chart, flag the steepest drop, watch a handful of recordings, and ship one small fix. Repeat that loop and your conversion rate climbs step by step instead of stalling out after the first round of changes.
Building that kind of repeatable system is exactly what separates brands that grow predictably from ones stuck guessing. If you'd rather have a team apply this same data-driven approach to your content and funnels, get your free 40+ slide social media strategy and see where your own drop-offs are hiding.