You post consistently, your reach looks decent, but you still can't answer the one question that actually matters: who is watching? If you've gone hunting for instagram insights audience demographics and come back confused about where the data lives or why it's missing entirely, you're not alone.
The short answer is that Instagram only shows age, gender, and location breakdowns to accounts with a Professional profile that has crossed a minimum follower or reach threshold, and the data sits inside the Insights tab, not the main analytics dashboard most people check first. Once you know where to look and what unlocks it, reading this data takes about two minutes.
This guide walks through the exact steps to find your audience demographics, what account requirements you need to meet before Instagram displays anything, and how to interpret the numbers once they show up. We'll also cover why this data disappears for some accounts and what to do about it. If you're building a personal or company brand and treating content as a real growth channel rather than a hobby, knowing your actual audience composition is the difference between guessing and directing your strategy with evidence.
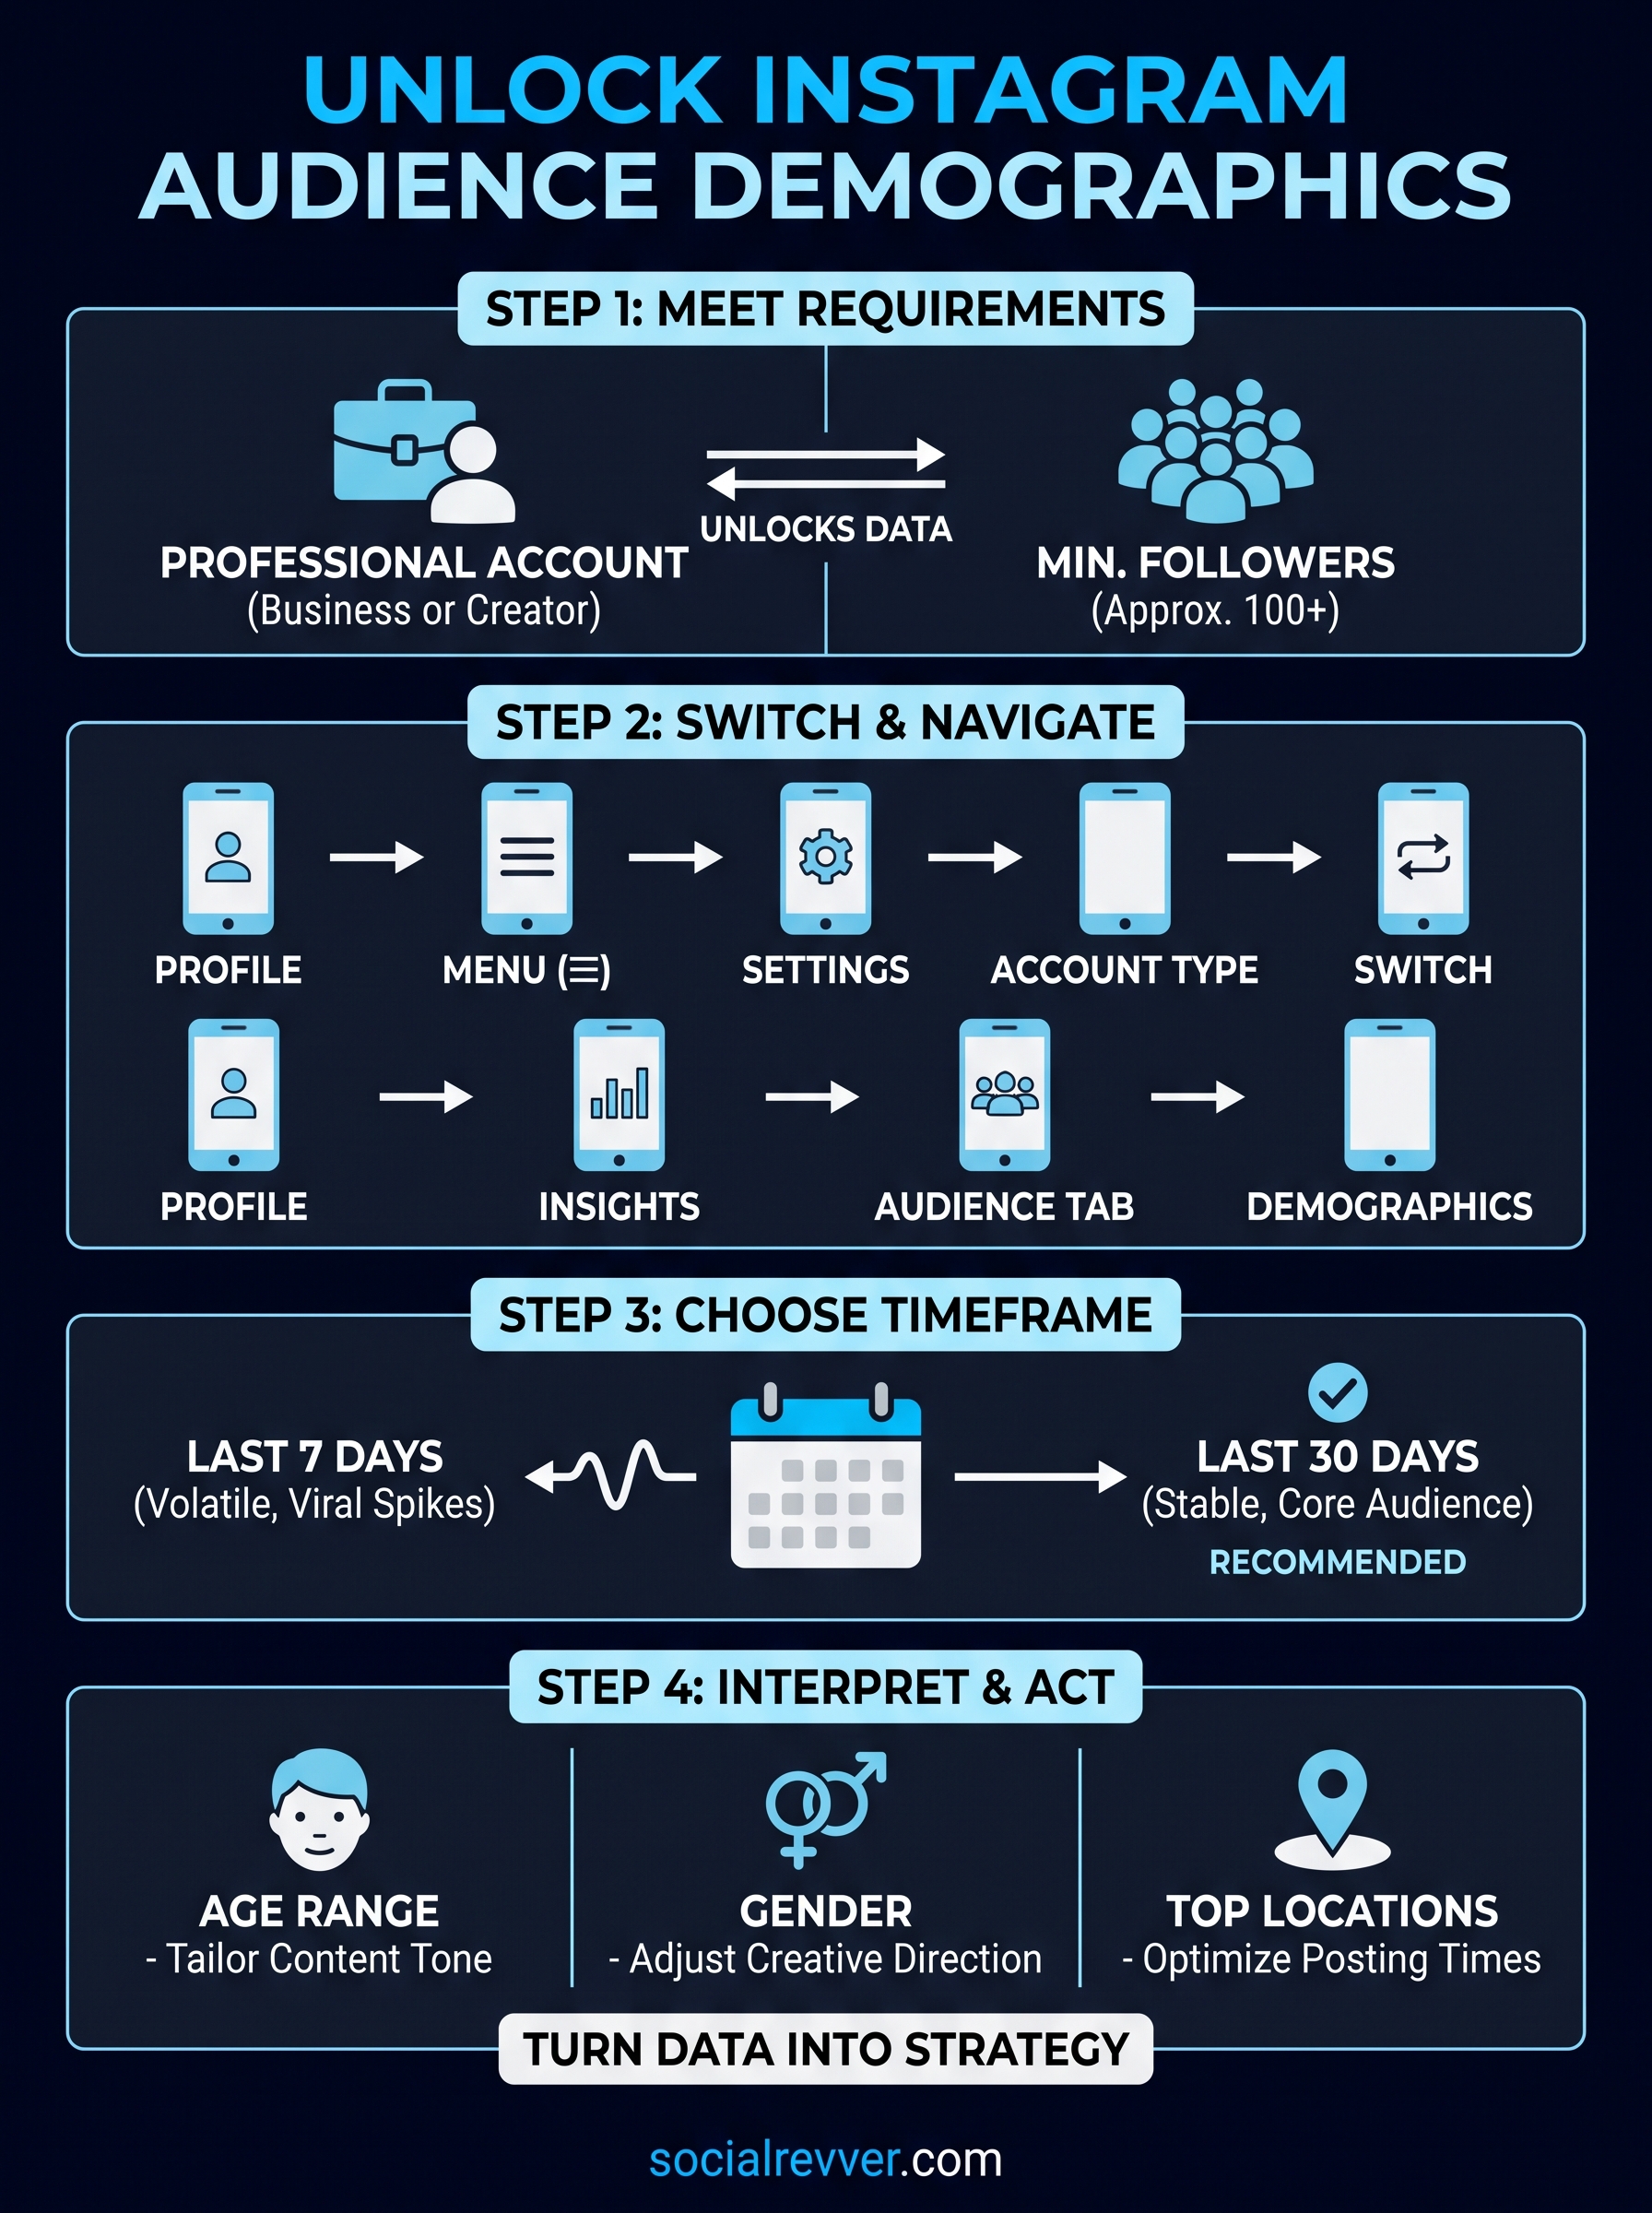
What you need to unlock audience demographics
Instagram doesn't hand demographic data to every account. Before you can see a single age or location breakdown, you need to clear two separate hurdles: the right account type and a minimum audience size. Miss either one, and the audience tab either won't exist or will show a blank screen with no explanation. This trips up more people than you'd expect, especially those who switched to a professional account months ago but never crossed the follower threshold Instagram quietly enforces behind the scenes.
The professional account requirement
First, your account has to be set up as either a Business account or a Creator account. Personal accounts never get access to Insights, period, no matter how many followers or how much engagement you're pulling in. This is a hard gate, not a suggestion. If you've never touched your account settings since signing up, there's a good chance you're still running a personal profile without realizing it, and that alone explains why the demographic panel is missing entirely.
The follower and reach threshold
Second, Instagram requires a minimum audience size before it will calculate and display demographic breakdowns. The company doesn't publish an exact number, but based on consistent observation across client accounts at SocialRevver, the practical floor sits around 100 followers, and some data points (particularly location and age granularity) only stabilize once you're past a few hundred followers with regular reach. Below that line, Instagram treats the sample size as too small to report reliably, likely both for privacy protection and statistical accuracy.
If your account is personal, under 100 followers, or barely active, Instagram simply won't show you who's watching, no matter how good your content is.
Here's a quick breakdown of what typically blocks or unlocks the data:
| Requirement | Why it matters | What happens if you don't meet it |
|---|---|---|
| Business or Creator account | Personal accounts have no Insights access | Audience tab doesn't appear at all |
| Minimum ~100 followers | Instagram needs a large enough sample | Demographic section stays empty or hidden |
| Recent activity (posts, Reels, Stories) | Insights calculates from actual reach, not just followers | Data can look incomplete or frozen |
| Public account (recommended) | Some data collection is limited on private accounts | Insights may show partial numbers |
Why the data sometimes vanishes
Even accounts that once had full demographic access can lose it. If your follower count drops below the threshold, if you go inactive for an extended stretch, or if Instagram flags unusual activity on the account, the audience breakdown can disappear until the account stabilizes again. This is one of the more frustrating quirks of Instagram audience insights, and it catches brand accounts off guard when someone on the team assumes the data will always be there once unlocked. It won't. Treat it as a rolling requirement, not a one-time achievement.
Once you've confirmed you meet both conditions, professional account status and enough followers with active reach, you're ready to actually go find the data. That's a straightforward process, but Instagram buries it a few taps deeper than most people expect.
Step 1. Switch to a professional account
Before you see a single number in Instagram Insights, you need to leave the personal account tier behind. This is a five-minute change, and most people who've never done it are surprised at how buried the setting is. Instagram doesn't advertise this switch because it wants you thinking about content, not account architecture, but skipping it means the entire audience demographics panel stays permanently out of reach.
Making the switch on your phone
Grab your phone and follow this path exactly, since Instagram reshuffles menu wording often enough that "close enough" navigation leads people astray:
- Open your profile and tap the three-line menu in the top right corner.
- Tap Settings and privacy, then scroll to Account type and tools.
- Select Switch to professional account and choose a category that matches your niche (this is cosmetic and easy to change later).
- Pick between Creator or Business when prompted.
- Confirm your contact info settings, then finish setup.
Once you land back on your profile, you'll notice a new Insights button sitting right under your bio. That button didn't exist a minute ago. It's your confirmation the switch worked.
Creator or Business, which one actually matters here
Honestly, for the purpose of unlocking audience demographics, it doesn't matter much. Both account types get identical access to age, gender, and location data inside Insights. Creator accounts lean toward influencers and personal brands with slightly more flexible categories, while Business accounts pull in extra tools like contact buttons and shopping tags that matter more to companies selling products. If you're a founder building personal authority, Creator usually fits. If you're running a company page, Business is the standard call.
The account type you pick barely affects your data. Skipping the switch entirely is what kills it.
Switching costs you nothing and reverses instantly if you change your mind. There's no reason to hesitate here, especially if you've been running a personal profile for months while wondering why the instagram insights audience demographics section never showed up. It was never going to, until now.
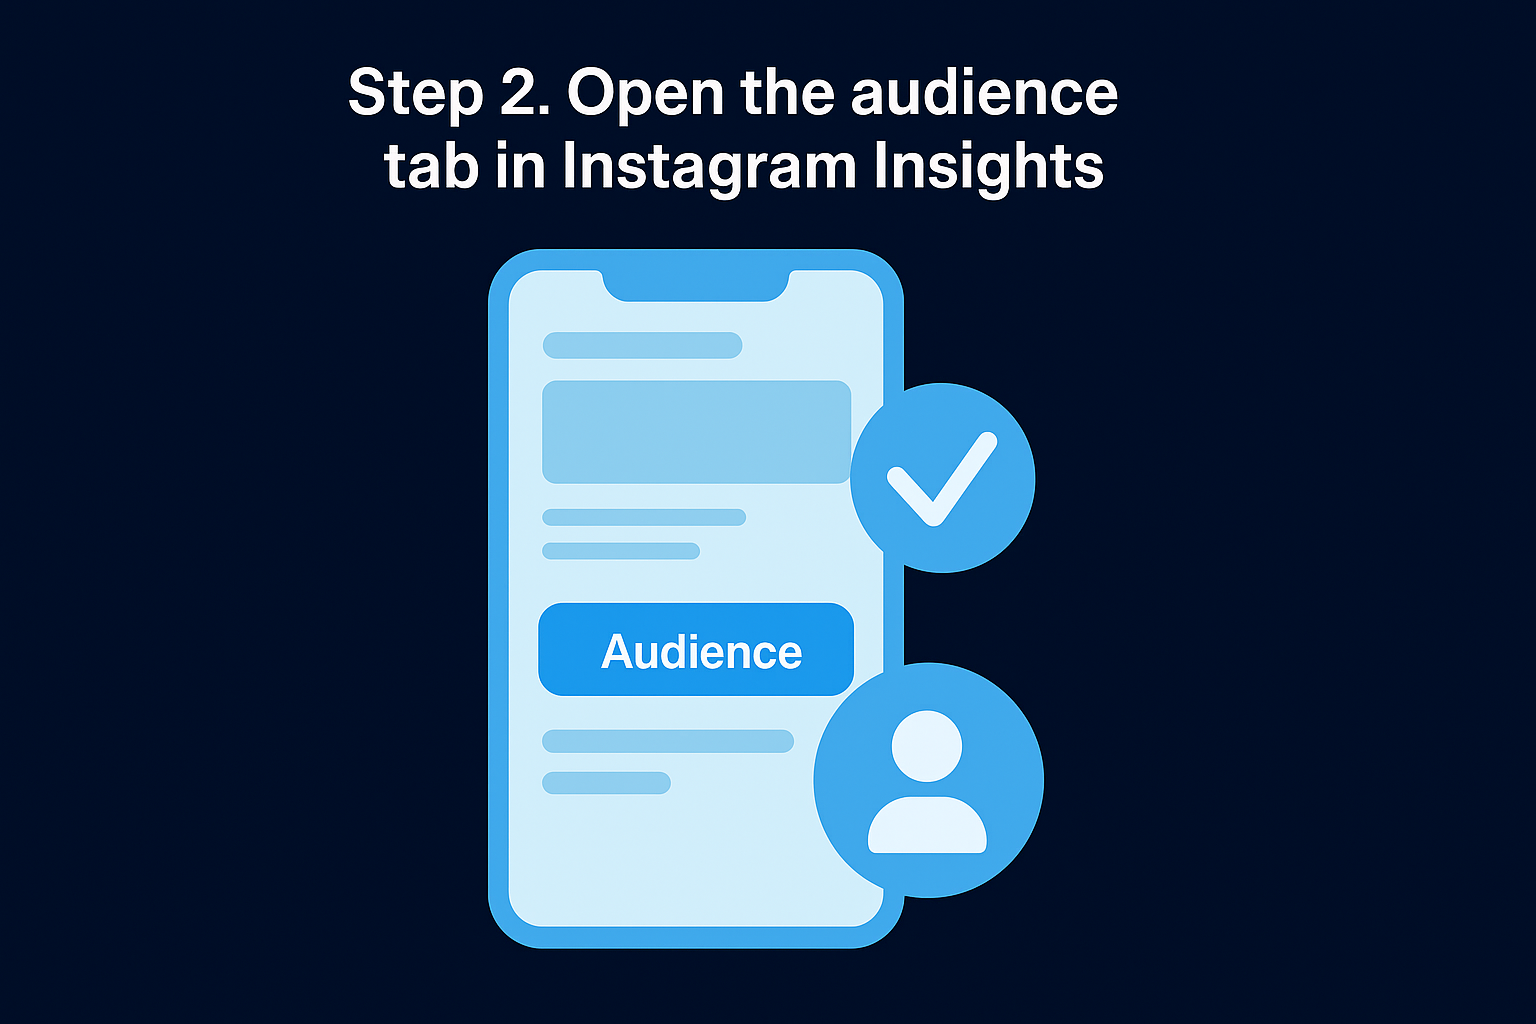
Step 2. Open the audience tab in Instagram Insights
With a professional account active, the next move is finding where Instagram actually tucks this data away. It's not on your main profile, and it's not in the app's general settings either. You have to go through the Insights button specifically, then dig one more layer to reach the audience breakdown.
Navigating to the audience tab
Follow these steps exactly, since Instagram nests this menu deeper than most first-time users expect:
- Go to your profile and tap Professional dashboard (or the Insights shortcut under your bio).
- Scroll down until you see Total followers or Your audience.
- Tap that section to open the full audience tab.
- Look for three sub-sections: Overview, Growth, and Demographics (wording varies slightly by app version).
- Tap Demographics to load age, gender, and location data.
If you land on a blank screen or a message saying Instagram needs more data, that's your signal to revisit the requirements from the previous section, not a bug in the app.
What you should see once it loads
Once the page loads correctly, you'll see a clean breakdown with three collapsible categories: top locations, age range, and gender. Each one expands into a bar chart or percentage list, and you can tap between followers and non-followers if your account has both segments tracked separately. This distinction matters more than people assume, since your non-follower reach often skews differently than your core audience, especially if a Reel just went semi-viral outside your usual crowd.
The demographics panel lives inside Insights, not your profile settings, and it only loads once Instagram has enough data to trust the numbers.
Giving the page a few seconds to load is normal, particularly on older phones or slower connections, since Instagram calculates these breakdowns in near real time rather than pulling from a cached report. Menu labels shift occasionally between app updates, so if a term doesn't match exactly what's described here, look for the closest equivalent rather than assuming the feature vanished. Instagram tests small wording changes constantly, but the underlying data structure stays consistent enough that anyone familiar with the general layout can adapt within seconds.
Step 3. Choose a timeframe that reveals your data
Once you're inside the demographics panel, Instagram asks you to pick a reporting window before it shows anything useful. This step trips people up constantly because the default range Instagram loads isn't always the one that gives you a full picture. Picking the wrong window can make your audience demographics look thinner than they actually are, or worse, blank entirely if your recent activity hasn't been enough to trigger a fresh calculation.
Picking the right window
Instagram typically offers a few preset ranges: last 7 days, last 30 days, and sometimes a custom range depending on your app version. Here's how to think about each one:
| Timeframe | Best for | Watch out for |
|---|---|---|
| Last 7 days | Checking reaction to a recent post or Reel | Small sample size, numbers can swing wildly |
| Last 30 days | Getting a stable, representative view of your core audience | Slower to update if you've been inactive |
| Custom range (if available) | Comparing performance around a launch or campaign | Not available on every account type |
For most people trying to understand who actually follows and engages with them, the 30-day view gives the most reliable signal. Shorter windows react too strongly to one viral post or one dead week, which skews the age, gender, and location split in ways that don't reflect your real audience.
Why the timeframe changes what you see
Switching between windows isn't just cosmetic. Location data especially can shift depending on whether a specific Reel pulled in an unusual regional spike. If you check a 7-day window right after a post blew up in a country outside your normal base, you might think your audience has fundamentally changed when it's really just a temporary spike from one piece of content.
Always check the 30-day window first. It's the closest thing Instagram gives you to a stable read on who your real audience is.
Give the app a moment after switching ranges, since Instagram recalculates the breakdown rather than instantly swapping a cached number. If a range shows no data at all, that usually means you didn't have enough reach during that specific window, not that something broke.
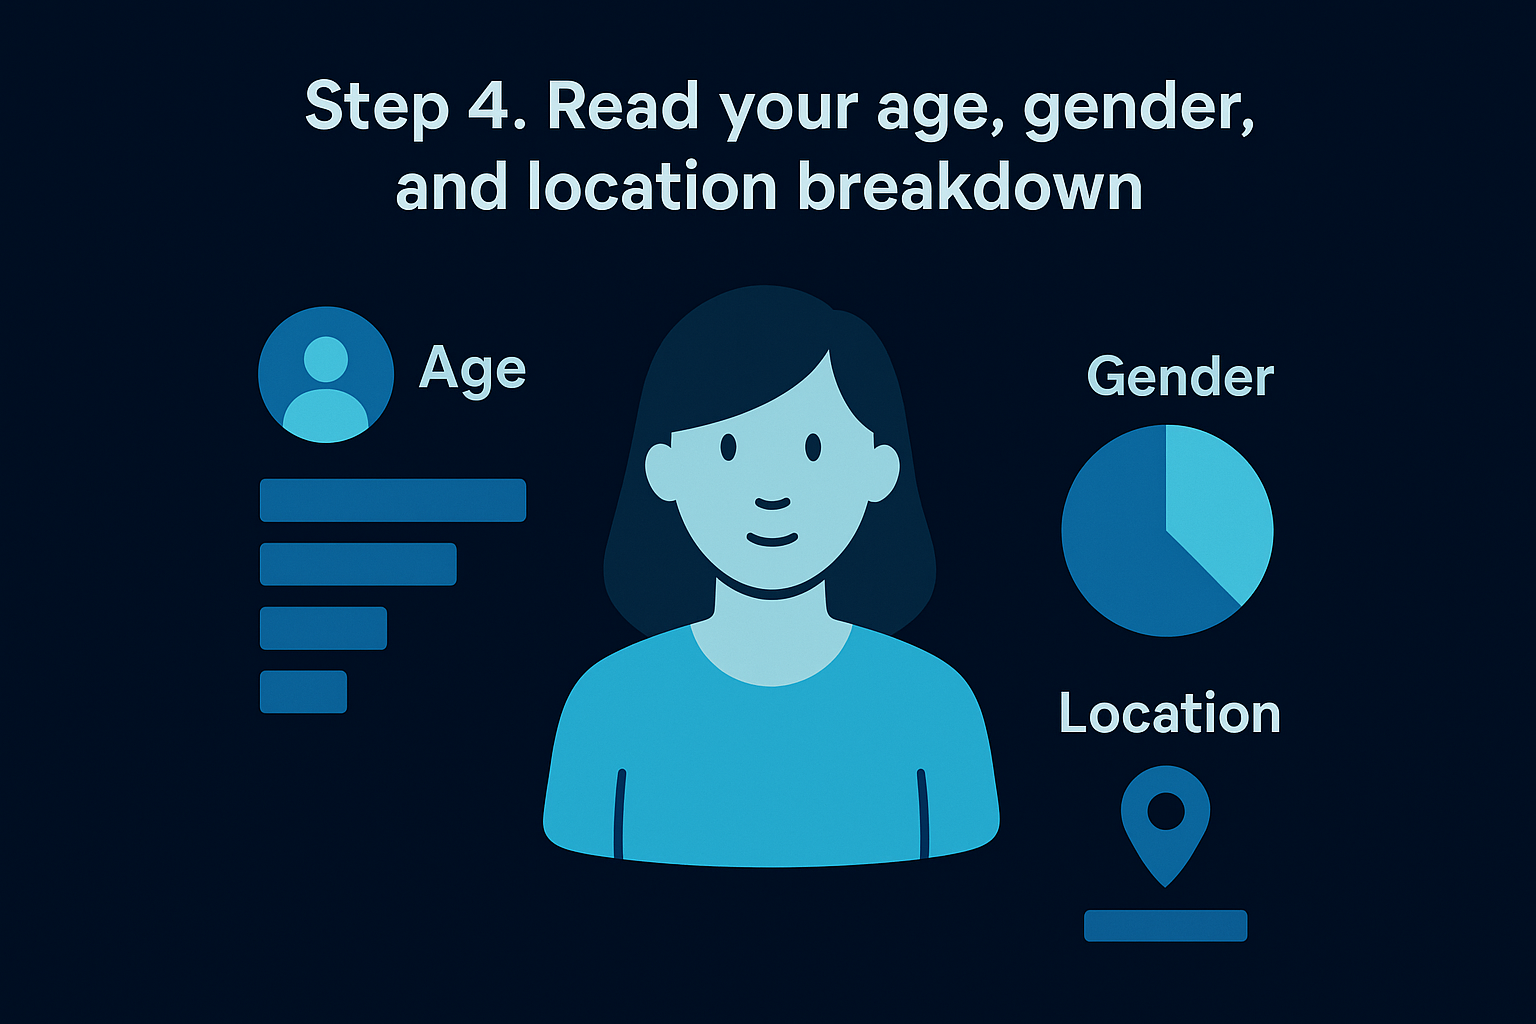
Step 4. Read your age, gender, and location breakdown
Now you're looking at actual numbers, and the real work starts here. Reading Instagram's demographic panel isn't complicated, but interpreting it correctly requires knowing what each metric actually tells you about your audience versus what it doesn't. This is where audience demographics stop being a curiosity and start informing decisions about posting times, content topics, and even the language you use in captions.
Breaking down the three categories
Each section reveals something different, and treating them separately matters more than skimming past them as one block of data.
- Age range: Shown in bands like 18-24, 25-34, 35-44, and so on. Look for where the biggest single chunk sits, not just the top two combined.
- Gender: A simple split, usually presented as percentages. Useful for tone and creative direction, less useful for granular targeting.
- Top locations: Broken into countries and cities. City-level data matters more than most people realize, especially for local businesses or event promotion.
What the numbers actually mean for your content
Getting a 34% concentration in the 25-34 age band tells you your content resonates with early-career professionals, not college students. That shifts everything from the references you make to the platforms you cross-post to. Location data works the same way. If half your top cities are outside your home market, your posting schedule built around your own timezone is probably working against you.
The demographic breakdown isn't trivia. It's a direct input into when you post, what you say, and who you say it to.
Spotting a mismatch between your assumed audience and the actual numbers happens more often than you'd think. Founders building personal brands frequently assume they're reaching decision-makers in their 30s and 40s, only to find a younger, broader audience pulling their reach. That's not necessarily bad news, it just means your instagram insights audience demographics should reshape your content calendar rather than confirm what you already believed. Cross-reference this with engagement rate by post type, and you'll usually spot which formats pull in your core demographic versus which ones just rack up passive views from outside it.
Turning audience data into a growth strategy
Knowing your audience demographics only pays off once you act on it. The age band, gender split, and top locations you just pulled from Insights should shape your posting schedule, your content topics, and the tone you write in, not sit forgotten in a screenshot. Most accounts check this data once, nod at the numbers, and go back to posting the same way. That's the gap between having information and running a real strategy.
If you're building a personal or company brand and want this data actually driving decisions instead of just satisfying curiosity, that's exactly what a structured system does better than manual guesswork. SocialRevver turns raw instagram insights audience demographics into scripts, posting schedules, and content built around who's actually watching. Get your free 40+ slide social media strategy and see what your audience data should be telling you.