
Posting consistently and still not sure what's working? You're not alone. Most founders and creators share content without a clear framework for how to measure social media engagement, and that blind spot makes it nearly impossible to connect effort to results. Without hard numbers, you're guessing. With the right metrics, you're making decisions.
The truth is, likes and follower counts only tell a fraction of the story. Real engagement measurement goes deeper, into how your audience interacts with your content, how often they take action, and whether that attention actually moves the needle for your business. These are the same data-driven principles we build into every client system at SocialRevver, where our Attention Engine™ analyzes performance patterns across hundreds of thousands of videos to identify what actually drives growth.
This guide breaks down the specific metrics that matter, gives you the exact formulas to calculate engagement rates, and walks you through a practical process for tracking performance over time. No fluff, just the measurement framework you need to turn raw social data into actionable insight and start treating your content like the revenue asset it should be.
What social media engagement really measures
Engagement isn't a single number. It's a collection of behavioral signals that tells you how your audience is actually responding to your content, not just whether they scrolled past it. When you understand how to measure social media engagement properly, you stop chasing volume and start reading signals that predict whether your content strategy is building real business value or just generating noise.
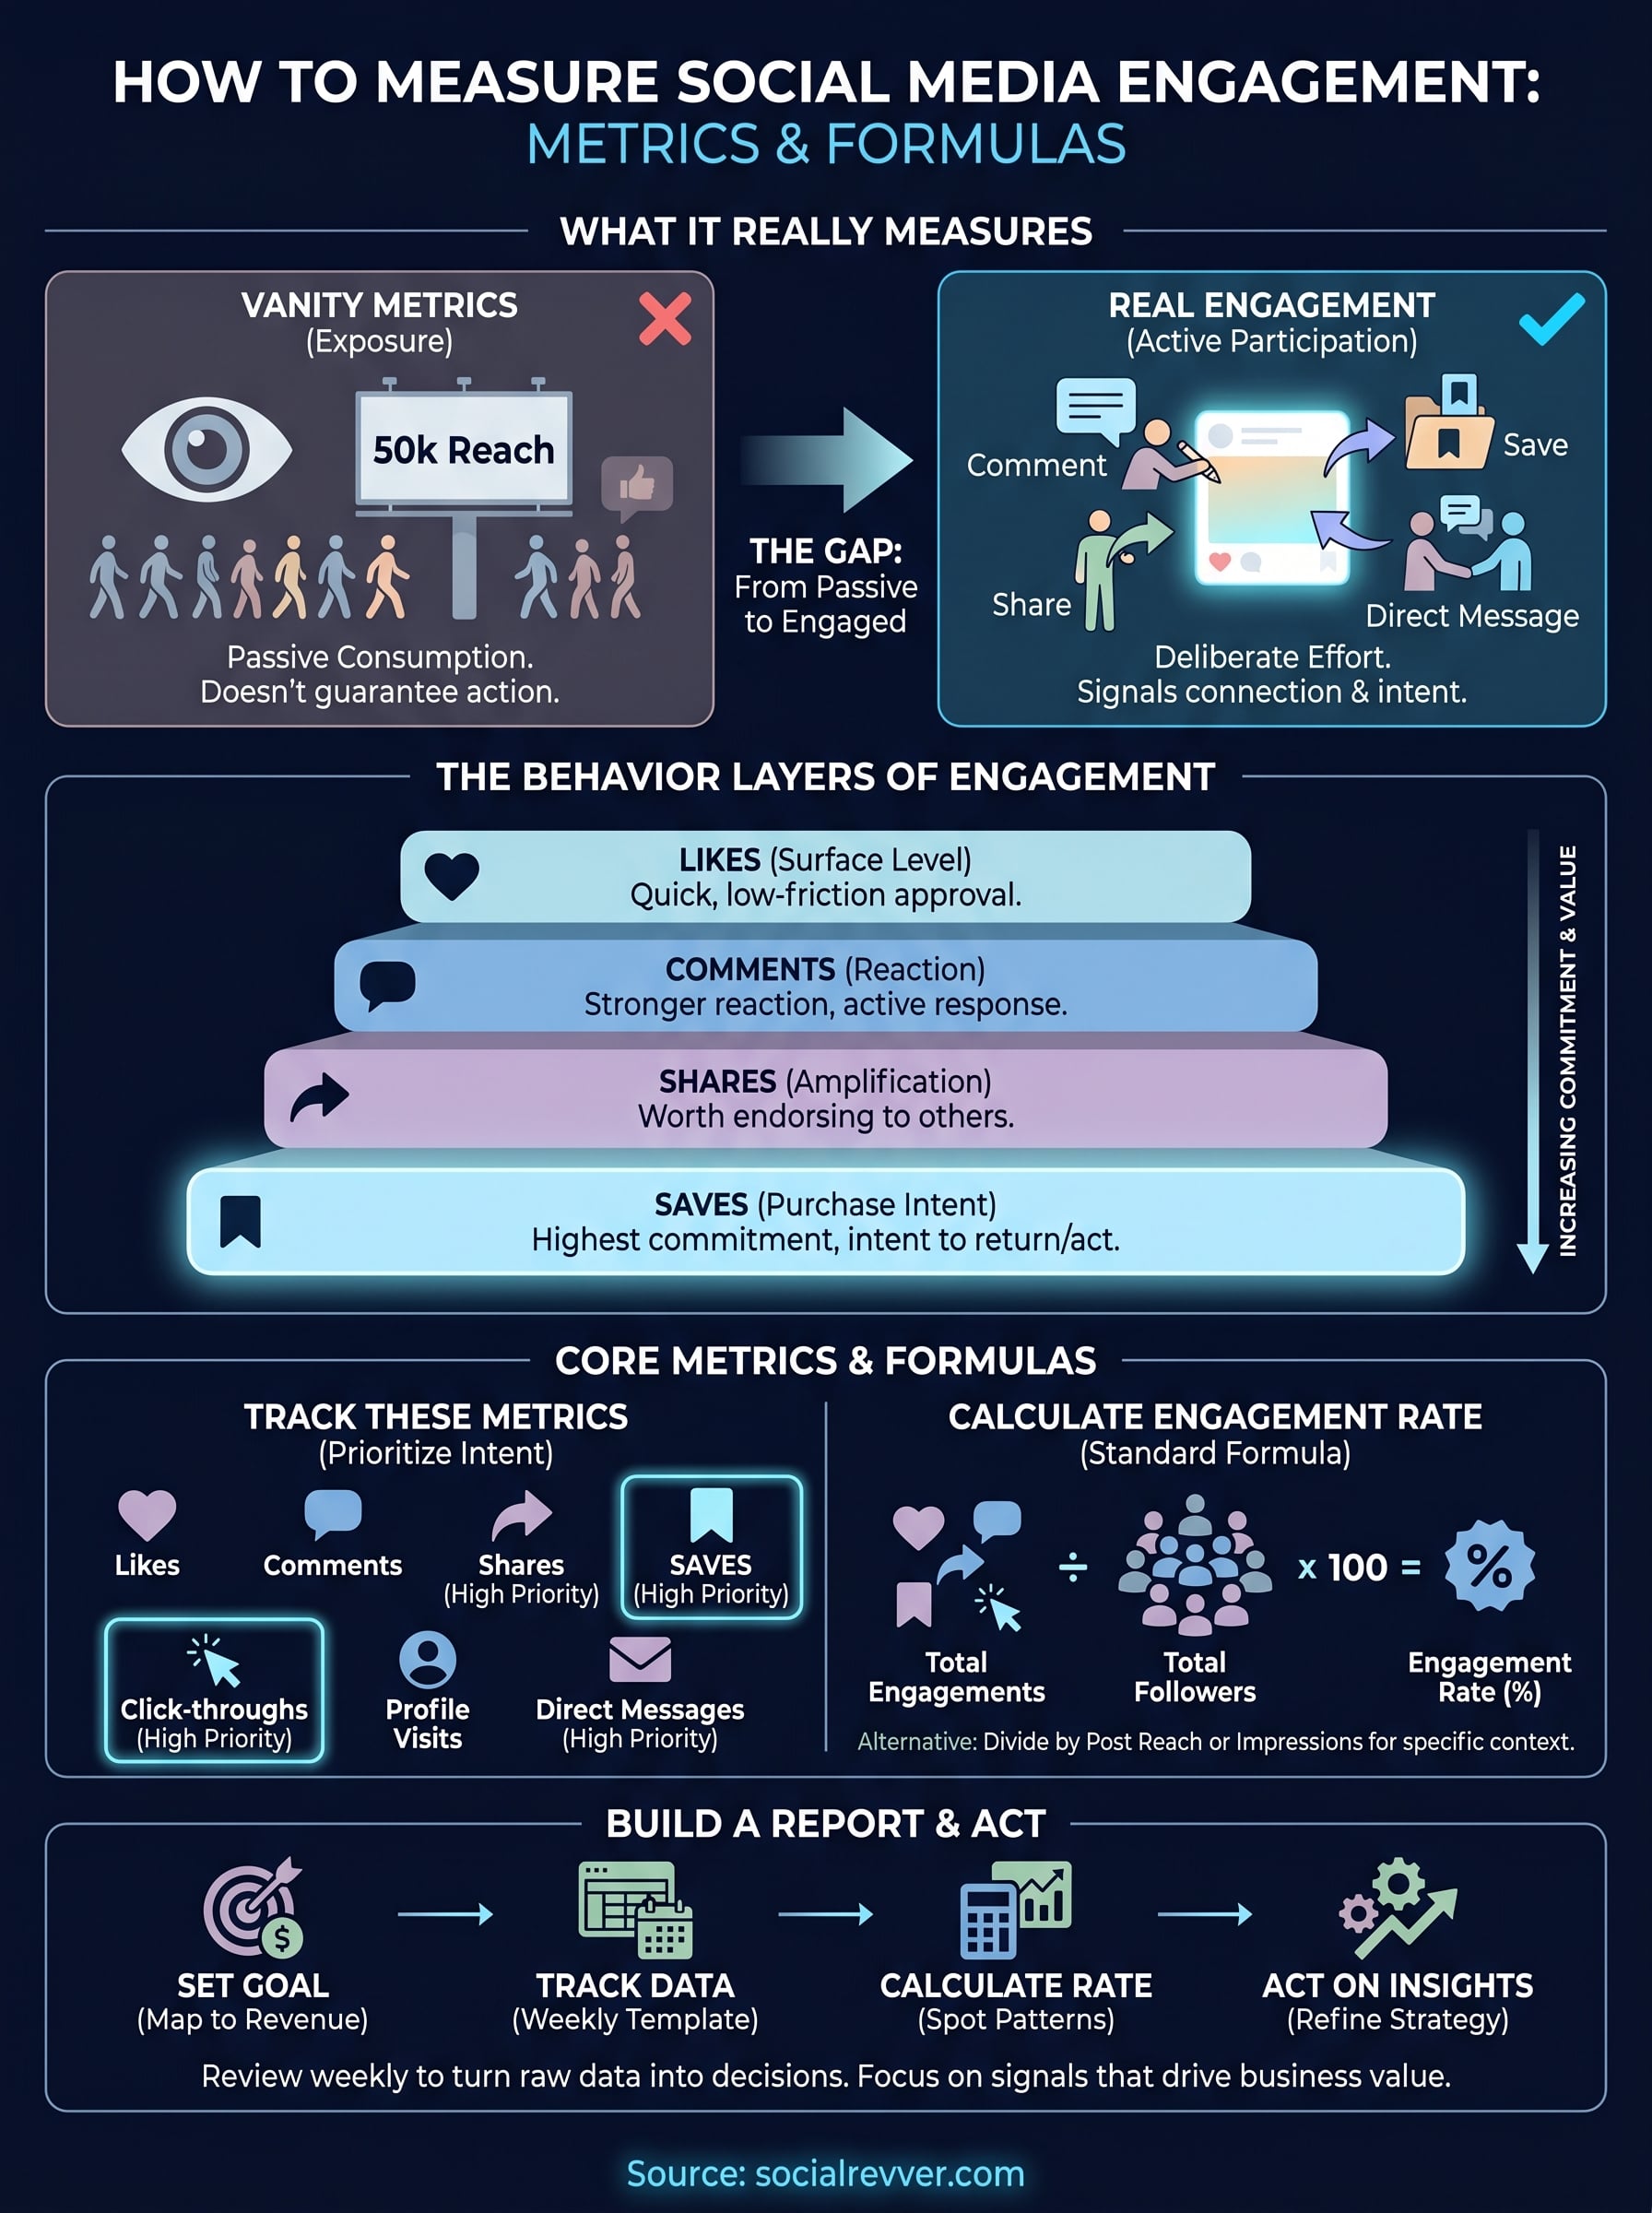
Vanity metrics vs. real engagement signals
Follower counts and impression numbers get a lot of attention, but they measure exposure, not response. A post that reaches 50,000 people but generates no comments, shares, or saves hasn't moved your audience to act. Vanity metrics feel significant because they're large, but they don't tell you whether your content resonated, persuaded, or prompted anyone to take the next step with your brand.
Real engagement signals measure active participation: a comment, a share, a save, a click-through, or a direct message. These actions require deliberate effort from the viewer. That effort is the data point that actually matters because it shows your content triggered a response strong enough to make someone stop and interact rather than keep scrolling.
The gap between a passive viewer and an engaged follower is the gap between a billboard audience and a real customer conversation.
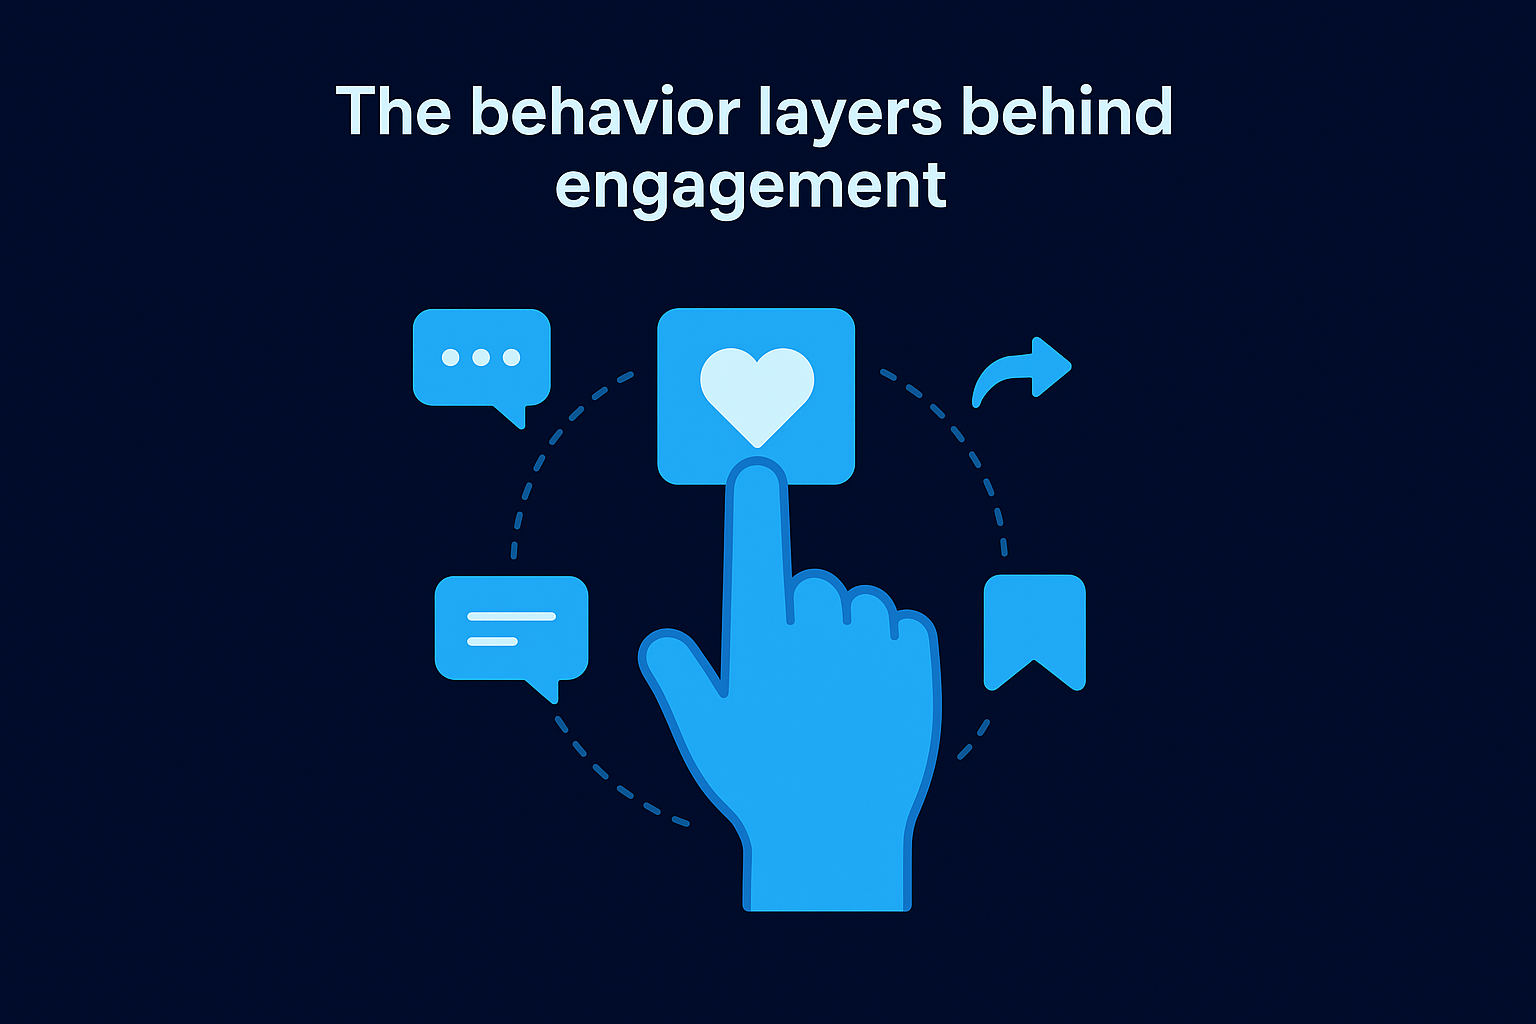
The behavior layers behind engagement
Every platform tracks multiple interaction types, and each one measures a different level of commitment from your audience. Likes sit at the surface since they're quick and low-friction. Comments signal that someone had a reaction strong enough to write it out. Shares indicate the person found the content worth putting their own name behind. Saves reveal an intent to return, which is one of the strongest purchase-intent signals available in short-form content.
Understanding these layers helps you diagnose your content far more accurately. If you're getting high view counts but almost no saves or shares, your content may be entertaining without being useful or persuasive enough to drive action. If comments are high but click-throughs are low, your call to action likely needs reworking. Each behavior layer gives you a specific diagnostic signal rather than a vague general impression.
Why engagement rate matters more than raw counts
Raw engagement numbers are misleading in isolation because audience size directly affects volume. A post with 500 likes from an account with 1,000 followers is dramatically stronger than a post with 500 likes from an account with 500,000 followers. Engagement rate normalizes these counts against your reach or follower base so you can make fair, apples-to-apples comparisons across posts, time periods, and platforms.
Tracking engagement rate consistently lets you identify your highest-performing content types, test new formats against a clear baseline, and build a data set that shows exactly what your specific audience responds to. That's the foundation any content system needs to grow predictably rather than by accident.
Step 1. Set goals and map engagement to revenue
Before you start pulling numbers, you need to know what you're measuring toward. Engagement data without a defined goal is just noise. Your metrics need to connect back to a specific business outcome, whether that's generating inbound leads, building authority in your niche, or converting viewers into buyers. Without this connection, you'll spend time tracking numbers that don't help you make a single business decision.
Define a primary goal for each content type
Your goal shapes which engagement signals carry the most weight in your tracking system. A founder building investor credibility needs to prioritize shares and comment quality, since those signals indicate thought leadership reaching new audiences. A business owner driving inbound leads should focus on click-through rate and direct message volume, because those behaviors signal that audience members are actively entering the funnel rather than passively consuming content.
Start by writing down one primary goal per content type you publish. Keep it specific and tie it to a behavior:
- Authority building: track shares, comment depth, and profile visits
- Lead generation: track link clicks, DMs, and bio link traffic
- Audience growth: track follower conversion rate and save rate
- Revenue conversion: track story swipe-ups, link-in-bio clicks, and product page traffic
Connect engagement metrics to revenue benchmarks
Once your goals are clear, you can build a direct line from engagement activity to a revenue outcome. This is the step most creators skip, and it's exactly why their reporting stays stuck at the surface level without producing actionable decisions.
If you can't trace a metric back to a business result, it doesn't belong in your core report.
A practical way to build this connection is to map your funnel stages against engagement types. Saves and shares drive reach, reach drives profile visits, profile visits drive link clicks, and link clicks drive conversions. Knowing where each metric sits in that chain tells you precisely which numbers to act on when performance drops at any stage.
Step 2. Track the core engagement metrics
Once your goals are mapped to outcomes, you need to know exactly which numbers to pull from each platform. Tracking the right metrics is the difference between a useful dashboard and a wall of numbers that doesn't drive any decisions. When you learn how to measure social media engagement at this level, you stop collecting data randomly and start building a focused signal set that reflects your specific growth objectives.
Platform-specific metrics to monitor
Each platform surfaces engagement data differently, but the core interaction types remain consistent across all of them. Focus on the metrics below as your baseline tracking set, regardless of which platform you publish on.
| Metric | What It Measures | Priority Level |
|---|---|---|
| Likes / Reactions | Surface-level approval | Low |
| Comments | Active audience response | Medium |
| Shares / Reposts | Audience amplification | High |
| Saves / Bookmarks | Purchase or return intent | High |
| Click-throughs | Funnel entry behavior | High |
| Profile visits | Brand curiosity signals | Medium |
| Direct messages | Direct conversion intent | High |
Pull these numbers for every post you publish, not just your top performers. Consistent tracking across all content gives you the comparative data you need to spot patterns rather than isolated wins.
Metrics that signal intent
Not all engagement carries equal weight when it comes to predicting business outcomes. Saves and shares are the two metrics most directly tied to downstream revenue activity because they indicate your content was useful or compelling enough for someone to act on it beyond a passive tap.
A post with 20 saves outperforms a post with 200 likes from a business-value standpoint almost every time.
Track direct messages and link clicks as your highest-priority conversion signals. These behaviors represent the narrowest, most intentional part of your engagement funnel, and spikes in either metric usually correlate with content hitting the right audience at the right decision stage. Review these weekly rather than monthly so you can act on momentum while it's still present.
Step 3. Calculate engagement rate with formulas
Knowing which metrics to collect only gets you halfway. Once you have your raw numbers, you need to run them through the right formulas to get an engagement rate you can actually compare across posts, platforms, and time periods. This is the mathematical core of how to measure social media engagement in a way that produces reliable, repeatable data rather than isolated snapshots.
The standard engagement rate formula
The most widely used calculation divides your total engagements by your follower count, then multiplies by 100 to express the result as a percentage. Total engagements means the sum of every interaction type you're tracking: likes, comments, shares, saves, and clicks combined.
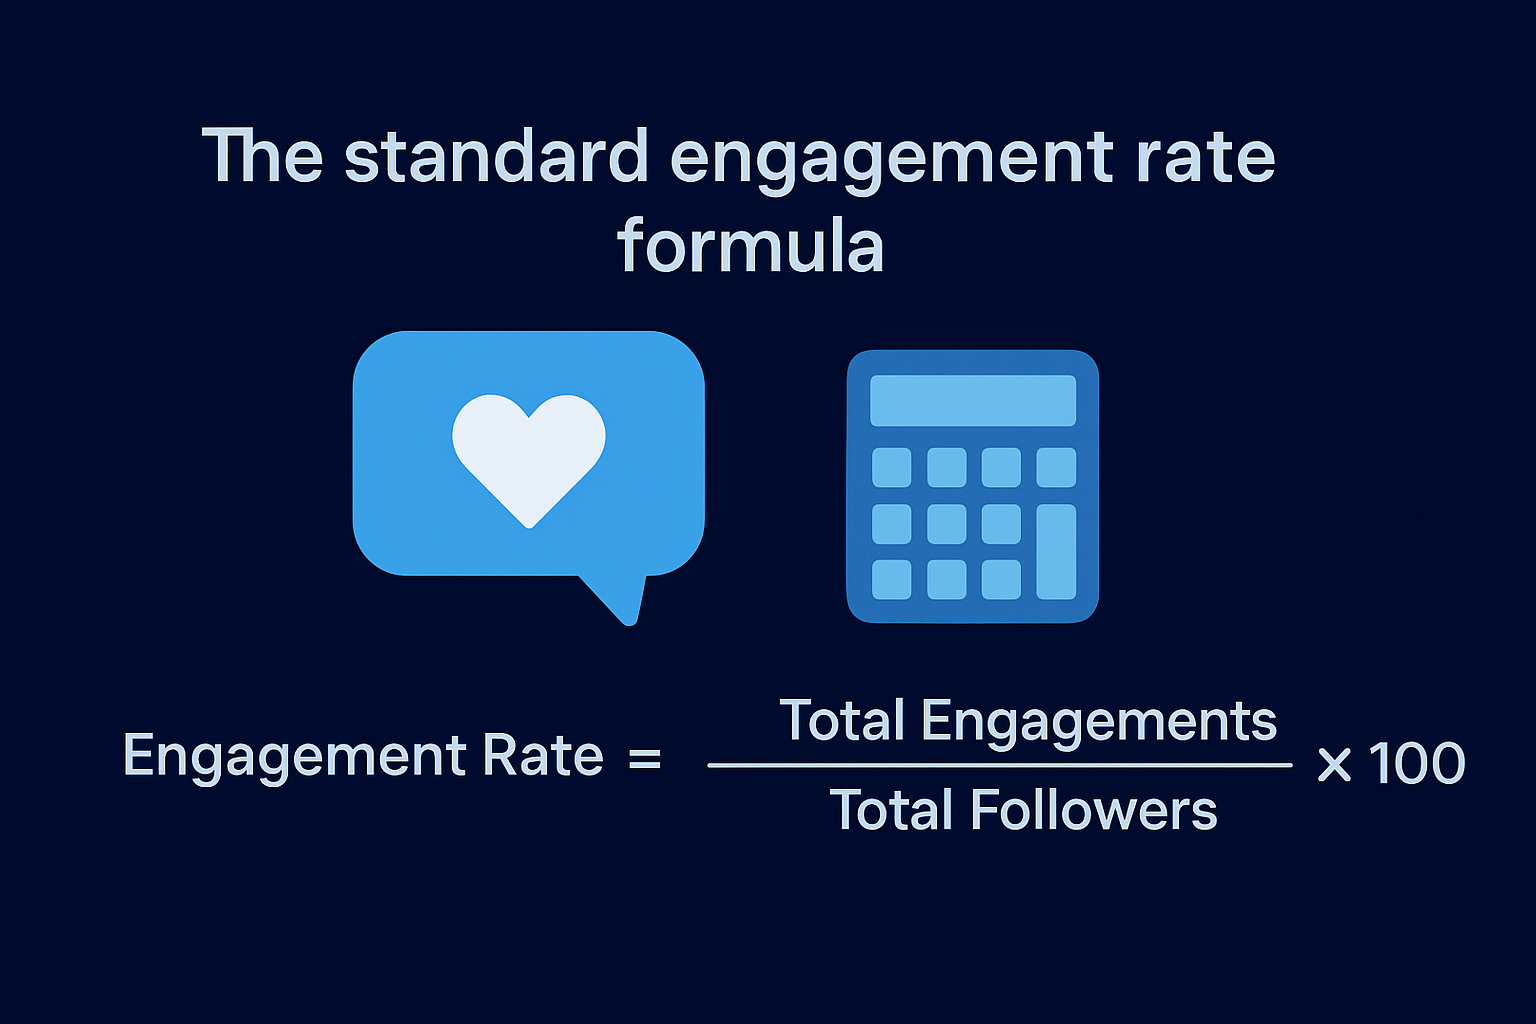
Engagement Rate (by Followers) = (Total Engagements / Total Followers) × 100
For example, if a post generates 350 combined interactions and your account has 7,000 followers, your engagement rate is 5%. Use this formula as your default baseline when comparing content performance within a single account over time.
Anything above 3% is considered strong on most platforms, but your real benchmark should always be your own historical average, not a generic industry number someone else published.
Platform-adjusted rate calculations
Follower-based rates work well for comparisons within your own account, but sometimes you need a more precise picture of how a specific post performed against the people who actually saw it. Reach-based and impression-based formulas give you that precision when the standard formula falls short.
Engagement Rate (by Reach)       = (Total Engagements / Post Reach) × 100
Engagement Rate (by Impressions) = (Total Engagements / Total Impressions) × 100
Use the reach-based formula when evaluating paid or boosted content, since reach filters out duplicate views from the same user. Apply the impression-based formula when analyzing content that received significant repeat exposure, such as a Reel that resurfaced through the algorithm multiple days after posting. Choosing the right formula based on context gives you a far more accurate diagnostic signal than locking into a single calculation for every post type.
Step 4. Build a simple report and act on it
Collecting metrics without organizing them into a report is how data gets ignored. A structured weekly report forces you to review your numbers on a consistent cadence and converts raw platform data into a clear decision-making tool. This is the final step in learning how to measure social media engagement in a way that actually changes what you publish, rather than just confirming what you already assumed.
Set up a weekly tracking template
Your report doesn't need to be complex to be useful. A simple spreadsheet with consistent column headers is enough to surface patterns over time. Pull your numbers every Monday for the previous week and track the same fields for every post so your comparisons stay clean and directly comparable.
Use this template as your starting point:
| Date | Platform | Post Type | Reach | Total Engagements | Engagement Rate | Saves | Shares | Link Clicks | Notes |
|---|---|---|---|---|---|---|---|---|---|
| 2026-05-01 | Reel | 4,200 | 310 | 7.4% | 85 | 42 | 28 | Strong hook | |
| 2026-05-03 | Video | 2,800 | 190 | 6.8% | 30 | 55 | 19 | Shared widely |
Keep at least 8 weeks of data before drawing conclusions about trends. Short observation windows produce misleading signals that push you toward bad creative decisions based on noise rather than real patterns.
Turn your data into decisions
The report only earns its value when you act on what it shows. After each weekly review, identify your single highest-performing post and your single lowest-performing post. Write one sentence in the Notes column explaining the likely reason behind each result. That habit builds a working theory of what your audience responds to, grounded in your own numbers rather than advice from outside your account.
The goal is not to produce a perfect report. The goal is to review it every week and change something based on what it tells you.
Set a standing 20-minute block each week to review your report, update your content plan, and carry forward what worked. That routine turns measurement from passive record-keeping into an active driver of your content strategy.
Next steps
You now have a complete framework for how to measure social media engagement: the metrics that matter, the formulas to calculate them, and a weekly reporting system that turns raw data into clear decisions. The difference between creators who grow predictably and those who stay stuck is not talent or luck. It's the discipline to track the right numbers and act on them consistently every single week.
Start with the basics. Pick three to five core metrics from Step 2, build your tracking spreadsheet this week, and run your first engagement rate calculation on your last five posts. That first data review will immediately surface patterns you've been missing, and it gives you a concrete baseline to measure every future post against.
When you're ready to move beyond manual tracking and build a full content system backed by data, apply to work with the SocialRevver team and get a free 40-slide social media strategy built around your specific goals.